12
THE NUCLEIC ACID DATABASE
INTRODUCTION
The Nucleic Acid Database (NDB) (Berman et al., 1992) was established in 1991 as a resource for specialists in the field of nucleic acid structure. Over the years, the NDB has developed generalized software for processing, archiving, querying, and distributing structural data for nucleic acid containing structures. The core resource of the NDB has been its relational database of nucleic acid containing crystal structures; now the database has incorporated structures derived by both X-ray crystallography and methods of NMR spectroscopy. Recognizing the importance of standard data representation in building a database, the NDB became an active participant in the mmCIF project and provided the test bed for this format. From a foundation of well-curated data, the NDB created a searchable relational database of primary and derivative data with very rich query and reporting capabilities. This robust database was unique in that it allowed researchers to make comparative analyses of nucleic acid containing structures selected from the NDB by means of the many attributes stored in the database.
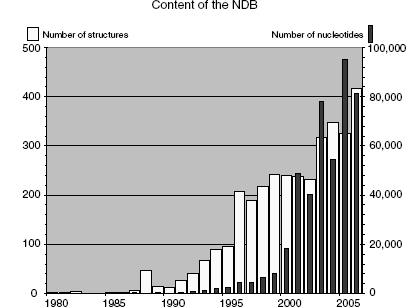
In 1992, the NDB assumed responsibility for processing all nucleic acid crystal structures that were deposited into the PDB, and in 1996, it became a direct deposit site. To meet data processing requirements, the NDB created the first validation software for nucleic acids (Feng, Westbrook, and Berman, 1998). The NDB continues to provide a high level of information about nucleic acids and serves as a specialty database for its community of researchers. When the NDB was established, the known world of nucleic acid structures consisted of DNA and RNA oligonucleotides, a few protein-DNA complexes, and some tRNA structures. Annotation of structural features was performed manually, and structures were easily classified into a few known molecular architectures by visual inspection. However, in the last 10 years investigators have uncovered a whole new universe of nucleic acid structures (Figure 12.1; see also Chapter 3). There are many ribozyme structures and many different types of protein-nucleic acid complexes represented in almost 2000 structures. Since information about ribosomal structures began to emerge in 2000, the number of nucleotide residues resident in the NDB has increased several fold (Moore, 2001).
Figure 12.1. Available nucleic acids and nucleotides per year at the time of writing (1980–2006). The total number of nucleic acid-only structures added per year is indicated by the light-colored bars (scale on the left); dark bars show the number of nucleotides in each year’s structures (scale on the right).
In this chapter, we describe the architecture and capabilities of the NDB and then present some of the research that has been enabled by this resource.
DATA PROCESSING AND VALIDATION
The NDB created a robust data processing system that produces high-quality data that are readily loaded into a database. The full capability of this system was recently demonstrated by the successful processing of ribosomal subunits, which are very large and complex structures.
Early on, the NDB adopted the Macromolecular Crystallographic Information File (mmCIF) (Chapter 10; Fitzgerald et al., 2006) as its data standard. This format has several advantages from the point of view of building a database: (1) the definitions for the data items are based on a comprehensive dictionary of crystallographic terminology and molecular structure descriptions; (2) it is self-defining; and (3) the syntax contains explicit rules that further define the characteristics of the data items, particularly the relationships between individual data items (Westbrook and Bourne, 2000). The latter feature is important because it allows for rigorous checking of the data.
The tools first developed by the NDB project are now used by the RCSB PDB and PDBj (both are members of the wwPDB; www.wwpdb.org; Berman, Henrick, and Nakamura, 2003) for processing both proteins and nucleic acids (Berman et al., 2000). A validation tool, NUCheck (Feng, Westbrook, and Berman, 1998) was developed especially for nucleic acids. It verifies valence geometry, torsion angles, intermolecular contacts, and the chiral centers of the sugars and phosphates. The dictionaries used for checking the structures were developed by the NDB Project from analyses of high-resolution, small-molecule structures (Clowney et al., 1996; Gelbin et al., 1996) from the Cambridge Structural Database (CSD) (Allen et al., 1979). The torsion angle ranges for double helical DNA forms were derived from an analysis of well-resolved nucleic acid structures (Schneider, Neidle, and Berman, 1997). One important outgrowth of these validation projects was the creation of the force constants and restraints that are now in common use for crystallographic refinement of nucleic acid structures (Parkinson et al., 1996). In addition to geometry checks, the molecular model is checked against the experimental data usingSFCheck (Vaguine, Richelle, and Wodak, 1999).
Once primary annotation and validation are complete, nucleic acid-specific structural and functional annotations specific to nucleic acids are added. These vary from broadly characterizing nucleic acid conformations as double helical A, B, or Z type to identifying simple structural features that are present, such as a bulge or helical loop. Proteins from protein-nucleic acid complexes are annotated for their function in the complexes as (1) structural proteins (e.g., ribosomal and histone proteins), (2) regulatory proteins (e.g., different types of transcription and translation cofactors), or (3) enzymes (e.g., polymerases, topoisomerases, and endonucleases).
THE DATABASE
Information Content of the NDB
Structures available in the NDB include RNA and DNA oligonucleotides with two or more bases either alone or complexed with ligands, natural nucleic acids such as tRNA, and protein-nucleic acid complexes. The archive stores both primary and derived information about the structures (Table 12.1). The primary data include the crystallographic coordinate data, structure factors, and information about the experiments used to determine the structures, such as crystallization information, data collection, and refinement statistics. Derived structural information, such as valence geometry, torsion angles, and intermolecular contacts, is calculated and stored in the database. Structural and functional features annotated specifically for nucleic acid containing structures are also loaded into the database.
Some structural features of nucleic acids have historically been derived using different algorithms, and therefore, it can be difficult to provide the most reliable values. Whenever possible, the NDB has promoted standards that allow for structural comparisons. For example, different values for base morphology parameters are produced by different programs (Lavery and Sklenar, 1989; Babcock, Pednault, and Olson, 1994; Bansal, Bhattacharyya, and Ravi, 1995; Lu, El Hassan, and Hunter, 1997; Dickerson, 1998). This meant that it was not possible to compare any two structures using published data, making it necessary to recalculate these values for any analysis. To help resolve this problem, the NDB cosponsored the Tsukuba Workshop on Nucleic Acid Structure and Interactions to which all the key software developers in this field were invited. They decided that a single reference frame would be used to calculate these values and agreed upon the definition of that reference frame (Olson et al., 2001). This work fully quantitates the proposal for base morphology made previously at ameeting in Cambridge (Dickerson etal., 1989). As aresult, these programs have been amended so that they produce very similar values for the base morphology parameters. The NDB has recalculated these values for all the structures in the repository using program 3DNA (Lu and Olson, 2003) and made them available as output from NDB searches and prepared reports.
TABLE 12.1. The Information Content of the NDB
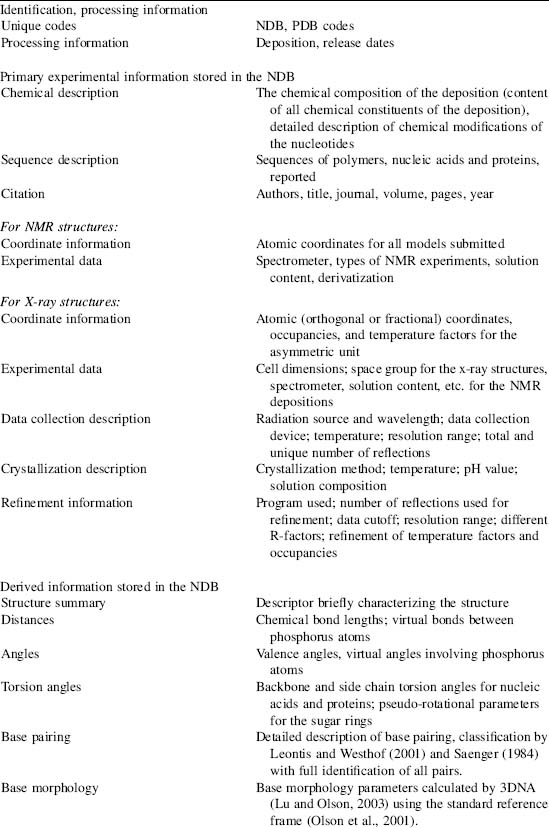
This table shows the types of data found in the NDB organized by content type. The database can be searched and reports can be generated using these characteristics.
User Web Access
The core of the NDB project is its relational database that can be used to query and report the stored structures. This resource is supplemented with other services. To secure wide and easy distribution of the NDB, all these services are accessible from an integrated web interface (http://ndbserver.rutgers.edu). The NDB home page links to the search and Atlas pages, coordinate and structure data, standards for nucleic acid geometry, prepared database reports, and tools (mainly programs) directly related to calculation or analysis of nucleic acid structural properties.
The Query Capabilities
The NDB relational database has all the data organized into more than 90 tables, with each table containing 5-20 data items. These tables include both experimental and derived information. For instance, the citation table contains all the items relevant for the relevant literature reference(s), the entity table contains critical items related to chemical entities observed in the structure, and the “entity_poly” table contains the sequences of polymer(s) observed in the structure that are indexed to the entity table.
A web interface was designed to make the query capabilities of the NDB as widely accessible as possible. There are two ways to query the NDB over the web: by simple “Search” and by “Integrated Search”. The simple search option is a web form in which the user enters text in a box or selects an option from the pull-down menu. Possible queries include NDB and PDB identification codes, author names, year of publication or release, experimental method, and chemical and structural characteristics, such as the presence of non-Watson-Crick base pairing, different types of double helices (B/A/Z/right-handed), tetraplex, or three- or four-way junctions. If no selection is made, the entire database is selected. After the query is executed, a list of structure IDs and descriptors that match the desired conditions is listed and the user can proceed to view the reported search results.
TABLE 12.2. Reports Available fortheNDB
| Report Name | Contains |
| NDB status | NDB and PDB IDs, processingstatus, release date, descriptor, |
| authors of the entries | |
| Primary citation | Authors, title, journal,volume, pages, year |
| Descriptor | Descriptor with NDB and PDBIDs |
| NA backbone torsions | Backbone torsions withunique residue identifier |
| Base pair parameters | Buckle, propeller, opening,shear, stretch, stagger with unique |
| pair identifier | |
| Base step parameters | Twist, rise, helical rise,tilt, roll, inclination, shift, slide, |
| unique step identifier | |
| Refinement information | Resolution limits andreflections used in refinement, R factor |
| Cell dimensions | Crystallographic cellconstants, space group |
These reports can be automatically generated for any database query results.
The “Integrated Search” provides the user with a wide range of options for structure selection and the use of Boolean operators to make complex queries. The interface consists of a series of pull-down menus that allow the selection of key components of database entries: citation information, experiment type and details, types of molecules present (DNA, RNA, protein, and ligand), presence of nucleic acid modifications, and nucleic acid conformation type (single/double/multiple helix, type of loop, and conformation type). After the user selects the desired defining criteria, the query is saved and executed; it can also be further modified for subsequent searches.
Several different reports or Atlas pages (see later) can be retrieved using either the Simple or Integrated Search tools (Table 12.2). Multiple reports can be generated for the same group of selected structures; this capability is particularly convenient for quickly producing reports based on derived features, such as torsion angles and base morphology.
Atlas Pages
An NDB Atlas report page summarizes the most important characteristics of a structure and provides information about the authors, citation, and sequence(s) of nucleic acids and proteins. These pages offer experimental information, a molecular view of the biologically relevant assembly of the reported structure, and links to tables of derived quantities, such as torsion angles, base morphology, and base pairing. Structural coordinates can be downloaded in either the PDB or mmCIF format, and a link is provided to the RCSB PDB’s Structure Explorer page (Figure 12.2).
Atlas pages are created directly from the NDB database for all entries and are organized by experimental method (X-ray or NMR), and by structure type into broad groups of structures (with possible overlaps). This permits effective browsing of the structures in the database. Atlas pages are accessible from database query results.
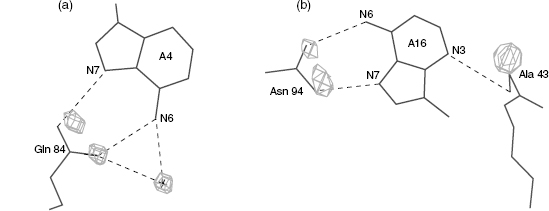
Figure 12.2. Different NDB Atlas pages for entry UR0027, a ribonuclease P RNA (Krasilnikov et al., 2003). (a) The main Atlas page provides summary information and links to coordinates, images, and tables of derived features of the entry; (b) classification of hydrogen bonding in base pairs of UR0027; (c) schematic 2D drawing of base pairing calculated and drawn by RNAView (Yang et al., 2003); and (d) torsion angles for UR0027.

DISTRIBUTION OF INFORMATION
In addition to these services, the NDB provides structural coordinate files, experimental data files, database reports, software programs, and other resources. They are available from the web (http://ndbserver.rutgers.edu/) and the ftp server (ftp://ndbserver.rutgers.edu).
Structural Coordinates and Experimental Data
Structural coordinate files can be downloaded in two formats, mmCIF and PDB. Coordinates for the complete biological assembly are distributed for crystal structures that do not have the asymmetric unit identical to the biological assembly. When available, experimental files, structure factors for X-ray structures, and distance restraints for NMR structures are made accessible to the community users.
Database Reports
The “NDB Reports” section of the website contains a large variety of precomputed information and tables useful to researchers looking for structure identifiers, citations, cell dimensions, and structure summaries. Prepared reports can be downloaded in the ASCII or PostScript formats for all structures currently in the NDB or for groups of structures similar to groups in the Atlas pages. Results from the program SFCheck (Vaguine, Richelle, and Wodak, 1999), which calculates agreement between coordinate model and structure factors, can be downloaded for all crystals structures with structure factors.
Standards and Software Tools
The “Standards” section provides dictionaries of standard (“ideal”) geometries of nucleic acid components as well as their parameter files for X-PLOR (Briinger, 1992). It also provides a full explanation of the Standard reference frame (Olson et al., 2001). The “Tools” section links to downloadable and web-based programs, a few of which are described here.
Several programs are available for examining RNA-containing structures. For any NDB structure or in a structure uploaded by the user, RNAViewer (Yang et al., 2003) generates a 2D representation of the base pairing using annotations according to Leontis and Westhof (2001). The Base Pair Viewer (BPView) can be used to select and interactively visualize base pairs or triples. RNAMLView (http://fjossinet.u-strasbg.fr/rnamlview) can display and edit 2D diagrams of RNA secondary structures with tertiary interactions created by RNAView. These programs use the RNAML syntax for exchanging RNA information (Waugh et al., 2002).
Two programs, predictdnaht and PDNA-pred, analyze protein DNA-binding structural motifs, namely, the helix-turn-helix (HTH) motif. Both can be used to predict if a protein target, either from the NDB archive or uploaded by the user, is a DNA-binding protein with the HTH motif (McLaughlin and Berman, 2003).
APPLICATIONS OF THE NDB
The NDB has been used to analyze characteristics of nucleic acids alone and complexed with proteins. The ability to select structures according to many different criteria has made it possible to create appropriate data sets for study. A few examples are given here.
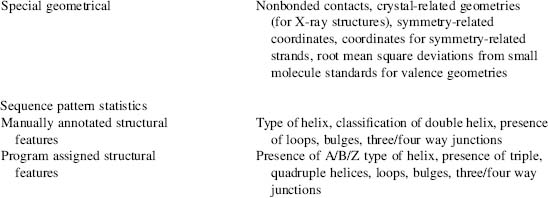
The conformational characteristics of A-, B-, and Z-DNA were examined by using carefully selected examples of well-resolved structures in these classes (Schneider, Neidle, and Berman, 1997). Conformation wheels (Figure 12.3a) for each conformation as well as scattergrams of selected torsion angles (Figure 12.3b) were created. These diagrams can now be used to assess and classify new structures. Studies of B-DNA helices have shown that the base steps have characteristic values that depend on their sequence (Gorin, Zhurkin, and Olson, 1995). Plots of twist versus roll are different for purine-purine, purine-pyrimidine, and pyrimidine-purine steps. This particular analysis was used to derive energy parameters for B-DNA sequences (Olson et al., 1998).
The interfaces in protein-nucleic acid complexes have been systematically studied. In an analysis of protein-DNA complexes, 26 complexes were selected in which the proteins were nonhomologous (Jones et al., 1999) (Figure 12.4). The results showed that there are amino acid propensities at these interfaces that are markedly different from those in protein-protein complexes. Generally, while protein-protein complexes have larger and more hydrophobic interfaces, the protein-DNA interface is dominated by hydrophilic and positively charged residues Arg, Lys, Asn, Gln, Ser, and Thr. It was also possible to place complexes into three classes: double-headed, single-headed, and enveloping. A similar analysis has also been done for protein-RNA complexes (Jones etal., 2001). Finally, detailed analyses of the hydrogen bonding patterns at the protein-DNA interface have found that CH … O bonds are surprisingly common (Mandel-Gutfreund et al., 1998).
Figure 12.3. Conformations for the double helical DNA. (a) Conformation wheel showing the torsion angles for a B-DNA dodecamer BDL001 (Drew et al., 1981). Black lines show actual values of torsion angles, and cyan background their allowed range in the B-type DNA conformation (Schneider, Neidle, and Berman, 1997). The gray shades in the outer rings show the average value(s) of the torsions in dark gray flanked by values of one and two estimated standard deviations in lighter gray; (b) Two scattergrams between the backbone torsions ζ (C3’-O3’-P-O5’), α (O3’-P-O5’-C5’), and γ (O5’-C5’-C4’-C3’) that show clustering of the most typical DNA forms (see Chapter 3 for more information on nucleic acid conformations). Figure also appears in the Color Figure section.
Some analyses have been done to investigate the potential impact of crystal packing on conformation. Although there are more than 30 different crystal forms of B-DNA in the NDB, the actual number of packing motifs (Figure 12.5) remains relatively small, with the most common motifs being minor groove-minor groove, stacking-lateral backbone, and major groove-backbone (Timsit, Youri, and Moras, 1992).
Minor groove-minor groove interactions, in which the guanine of one duplex form hydrogen bonds with the guanines of a neighboring duplex, are seen not only in dodecamer structures but also in an octamer sequence that has three duplexes in the asymmetric unit (Urpi et al., 1996). The second motif contains duplexes stacked one above another with the adjoining phosphates forming lateral interactions. A large number of variations of this motif have been observed in decamer (Grzeskowiak et al., 1991) and hexamer structures (Cruse et al., 1986; Tari and Secco, 1995). The third type of packing involves the major groove of one helix interacting with the phosphate backbone of another (Timsit et al., 1989). Sequence appears to be a large factor in determining these motifs, but it is not the only one. For example, the first structures known to exhibit the major groove-phosphate interactions contained a cytosine that formed a hydrogen bond to the phosphate. However, not all structures containing this motif have this hydrogen bond (Wood et al., 1997). The particular sequence in this crystal is even more intriguing because it also crystallizes into another form in which the terminal flips out to form a minor groove interaction with another duplex (Spink et al., 1995).
Figure 12.4. Interfaces of protein–DNA complexes. (a) Histogram of the interface residue propensities calculated for 26 protein–DNA complexes and compared to those for permanent protein–protein complex (Jones and Thornton, 1996). A propensity of >1 indicates that a residue occurs more frequently at the interface than on the protein surface. (b) Schematic drawings that model protein–DNA complexes for double-headed binding proteins. The diagrams give an indication of the predominant secondary structure of the binding motif, protein symmetry, and the type and relative position of the DNA groove bound. The secondary structure of the predominant binding motifs are indicated using different symbols analogous to those used in TOPS diagrams (Westhead et al., 1998). The symmetry of each protein is indicated by using a different color for each (pseudo)symmetry-related element. A single symbol shaded in two colors indicates that there are secondary structures of this type contributed by more than one symmetry-related element. Reprinted with permission from Jones et al. (1999). Figure also appears in the Color Figure section.

The task of trying to determine the relative effects of base sequence and crystal packing on the values of the base morphology parameters is hampered to some degree by the uneven distribution of the 16 different base steps among the different crystal types. Some steps like CG are very well represented in B structures, whereas others such as AC have very few representatives in the data set. Nonetheless, there are a few steps that occur in crystals with different packing motifs. An analysis of the CG steps across all crystal types show that its conformation is relatively insensitive to crystal packing and the distribution is similar to that foundforall steps (seeBerman,Gelbin, and Westbrook, 1996). Onthe other hand, the variability of the CA step appears to depend not simply on crystal type but on the packing motif. The values of twist for CA steps in minor groove-minor groove motifs are smaller than those for the major groove-backbone motif. Very high values are displayed for CA steps in the stacking-lateral backbone motif. Plots of twist versus roll for CG steps show the distribution noted by others (Gorin, Zhurkin, and Olson, 1995); clustering is not observed to be dependent on crystal type. On the other hand, the same plots for CA steps show very distinctive differences that appear to depend on the packing motifs. It is important to note here that these motifs encompass several crystal types so that the structural variability observed is a function of a particular type of structural interaction rather than a particular crystal form. Before any definitive statements can be made about all the steps, it will be necessary to have much more data.
Figure 12.5. Examples of packing motifs in B-DNA duplexes. From left to right: (a) minor groove–minor groove interactions in BDL042 (Leonard and Hunter, 1993); (b) major groove– backbone interactions in BDJ060 (Goodsell, Grzeskowiak, and Dickerson, 1995); (c) stacking interactions in BDJ025 (Grzeskowiak et al., 1991). The bases are colored green for guanine, yellow for cytosine, red for adenine, and blue for thymine. Reprinted from Berman, Gelbin, and Westbrook (1996) with permission from Elsevier Science. Figure also appears in the Color Figure section.

In a series of systematic studies of the hydration patterns of DNA double helices, it was found that the hydration patterns around the bases are well defined and are local (Schneider and Berman, 1995). That is, small changes in the conformation of the backbone do not affect the hydration around the bases. It was also found that there are more diffuse patterns around the phosphate backbone that are dependent on the conformational class of the DNA (Schneider, Patel, and Berman, 1998). These analyses were used in an attempt to predict the binding sites of protein side chains on the DNA. The hydration sites of the DNA were predicted for a series of protein-nucleic acid complexes, and then compared with the known location of the amino acid side chains in these structures. The results were surprisingly good; the side chain sites and the predicted hydration sites in most cases were very close (Woda et al., 1998) (Figure 12.6).
Variable conformations of nucleic acids and complicated folds of large RNA molecules, such as ribosomal RNA, present a challenge to structural scientists. Several groups have analyzed torsional distributions of RNA backbone approximately at the nucleotide level (Murthy et al., 1999; Hershkovitz et al., 2003; Murray et al., 2003; Sims and Kim, 2003; Schneider, Moravek, and Berman, 2004) and have demonstrated that RNA prefers relatively small number of conformations. These studies used traditional small-molecule descriptors—torsion angles.
Figure 12.6 Hydration at the protein-DNA interface. Shown are amino acids and bases interacting in the (a) Lambda repressor-operator/DNAstructure PDR010 (Beamer and Pabo, 1992) and (b) MAT a2 homeodomain-operator/DNA complex PDT005 (Wolberger et al., 1991). The density cages represent the predicted hydration sites around the bases and are calculated withoutthe knowledge of the amino acid positions. The agreement between the predicted hydration sites and the positions of the amino acid hydrogen bonding atoms is very good. In figure (a), the hydration site and the actual crystallographic water (labeled with a cross) also overlap well.
These and other atomic scale descriptors, such as base morphology, are too detailed to describe the architecture of large RNA molecules. They need to be supplemented by descriptors that provide more robust definitions of larger structural motifs that scale between several and dozens of nucleotides. New algorithms need to be developed to allow automatic identification of these motifs in structures across the archive as well as in new depositions and represent them in the database schema in such a way that they can be queried and reported.
A first step in creating a more robust definition for categorizing RNA structures has been conducted for a database containing RNA motifs (SCOR) (Klosterman et al., 2002; Klosterman et al., 2004). The goal of the RNA Ontology Consortium (ROC) is to create a set of better definitions and systematic methods for searching structural motifs by combining base pairing, base stacking, and thebackbone conformations (Leontis et al., 2006). However, systematizing a set of robust definitions for these larger structural motifs remains a challenging task ahead.
ACKNOWLEDGMENT
Funding from the National Science Foundation and the Department of Energy is gratefully acknowledged.