15
THE IMPACT OF LOCAL ACCURACY IN PROTEIN AND RNA STRUCTURES: VALIDATION AS AN ACTIVE TOOL
INTRODUCTION
The enormous wealth of macromolecular structure data already available and the even greater wealth soon to come—from structural genomics, from the push for atomic-resolution structures, and from the push to solve much larger biological complexes, often including nucleic acids as well as proteins—provides a treasure trove of functional, interactional, and evolutionary data that change the idea how one can do biology. To make an effective use of this great resource, however, it is important, among other things, to take into account the very large spread of accuracy in those data. Relatively low-resolution structures can be among the most valuable ones if they are of critical molecules or of large and complex cellular machinery. These structures show overall fold and relative positioning of their interacting parts and they often illuminate function in surprising ways, but one should not expect to learn from them fine details in an active or allosteric site or the critical local differences that determine specificity for molecular interactions. Cryoelectron microscopy techniques are developing rapidly and are especially good at characterizing movements in large complexes. In combination with crystal structures of the components, models with full atomic coordinates can be built; those show overall positioning well, but the interface details are only approximate. At the other extreme, increasing numbers of structures are being solved at better than 1 A resolution, where one can reliably detect minute changes at catalytic sites or disentangle multiple conformations of side chains, loops, ions, and waters. Neutron diffraction can add further critical details of H-bonding and protonation.
Within an individual structure, however, there can be even wider variability in local accuracy. Regardless of resolution, most structures have a few parts disordered enough that they are not visible at all in a crystallographic electron-density map (or have no observable NMR restraints), and other parts only weakly tied to data. In some cases (especially at chain termini), the coordinates of those atoms will be omitted in the data bank file, but more often disordered areas are indicated by a high crystallographic B-factor or by highly divergent conformations in an NMR ensemble. If a particular part of a structure is important to the question being asked, these telltale signs should always be heeded—they indicate that the local conformation is highly uncertain, either because of molecular motions or because of problems with the data. Regions of locally ambiguous data unfortunately not only produce a higher level of random errors but also quite often result in systematic errors of interpretation that move atoms by several Ångstroms.
Global evaluations of structure quality are valuable to a bioinformatics end user in choosing which PDB file for a given molecule to include in a broad analysis. Local evaluation scores are even more valuable, however, since no level of global quality can protect against a large local error in the region of specific interest. This chapter will concentrate on explaining how it is feasible for an end user to evaluate a local region of interest within a structure, and determine either that it belongs to the reliable majority or that it is one of the rare (but not rare enough!) cases poorly determined by the data, or even is physically impossible.
Many of the basic quality indicators such as resolution, B-factor, R, and free R residuals (measures of how well the model accounts for the observed data) for crystallography, or model root-mean-square deviations (RMSD) and restraint violations for NMR, are directly reported in the Protein Data Bank (PDB) coordinate file (Chapter 10). Beyond those indicators, the subject known as structure validation (Chapter 14) provides further tools for assessing both overall and local accuracy of structures. Traditional validation programs such as ProCheck (Laskowski etal., 1993; available under the PDBSum link at the PDB site), WhatCheck (Hooft et al., 1996; http://swift.cmbi.ru.nl/gv/whatcheck/), or the Adit deposition process at the PDB (Westbrook et al., 2003; http://deposit.rcsb.org/validate/) provide a broad set of widely used tools, centering especially on ideality of molecular geometry (bond lengths and angles) and on whether protein backbone and side chain dihedral angle combinations occur outside the preferred “core” regions. The largest outliers on some of those criteria are reported in remark 500 of the PDB file header. There also are validation programs that evaluate the experimental data (if available), others that provide an evaluation of the empirical favorability of each residue’s surroundings (especially useful for detecting mistakes in chain tracing), and web servers that run several of the above programs for you on an uploaded file, as described in Chapter 14.
Of special importance in validation are independent criteria, not explicitly part of the
target function optimized by the structure refinement process, because the new information makes their
deviations more sensitive and robust indicators of problems. The two such classic indicators are (1) the
backbone  , ψ, or “Ramachandran” plot
(Ramachandran, Ramakrishnan, and Sasisekharan, 1963; Laskowski et al., 1993; Kleywegt and Jones, 1996;
Lovell et al., 2003), since joint , ψ
values are not in usual target functions, and (2) the free R-factor (Brunger, 1992), which measures
agreement between the model and a designated 5-10% of the data that are deliberately kept out of
refinement to provide an unbiased indicator of progress in model quality.
, ψ, or “Ramachandran” plot
(Ramachandran, Ramakrishnan, and Sasisekharan, 1963; Laskowski et al., 1993; Kleywegt and Jones, 1996;
Lovell et al., 2003), since joint , ψ
values are not in usual target functions, and (2) the free R-factor (Brunger, 1992), which measures
agreement between the model and a designated 5-10% of the data that are deliberately kept out of
refinement to provide an unbiased indicator of progress in model quality.
Recently, we have discovered, in a surprisingly simple place, a plentiful new source of information for an unbiased and sensitive validation criterion: the hydrogen atoms. They constitute about half of the atoms, but for expediency or technical reasons, they are almost always either left out altogether or not treated fully. H atoms are, of course, important and present in NMR structures, although often not given their full atomic radius. In macromolecular crystallography, polar H atoms are often added to better define H-bonds but with no vander Waals terms, while nonpolar H atoms are added and refined against the data only at ultrahigh (near 1 Å) resolution. The main reason for this is that hydrogens diffract X-rays very poorly, so that they can be directly detected only under the best of conditions.1 The second reason is that including hydrogens doubles the number of refinement parameters if their coordinates are treated as fully independent variables, which is acceptable only when there is a large enough number of experimental observations. Finally, only recently has computer speed allowed the extra cost in time, either for structure refinements or for theoretical calculations. The volume of the H atom is accounted for in a standard way by using larger “united atom” radii for the other atoms, but the directionality and specificity of H interactions are not represented. The net result of all this is that the crystallographers have obligingly ignored half their atoms in refinement, managing to do quite well without them, but opening up the opportunity for us to use the correctness of the hydrogen’s tight and specific packing interactions as both a global and especially a local validation criterion. This relatively new method (Word et al., 1999a) is called all-atom contact analysis and is most often accessed on the MolProbity web server (http://molprobity.biochem.duke.edu; Davis et al., 2007).
As an active tool applied to the structural database, all-atom contact analysis has two different goals. The first, long-term goal is to actually improve the accuracy of the database entries, by having structural biologists apply the criteria themselves and fix many errors before coordinates are deposited (a similar process occurred several years ago with routine application of free R and Ramachandran plot criteria). The second goal is to give users of the database an easy and effective way to assess local structural accuracy. The first goal would produce higher grade ore for data mining, whereas the second improves the extraction process.
METHODOLOGY OF ALL-ATOM CONTACT ANALYSIS
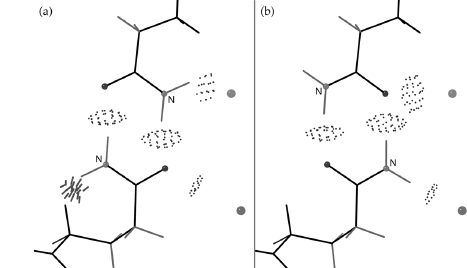
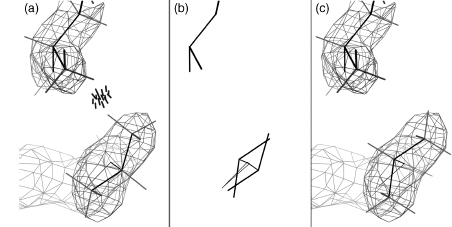
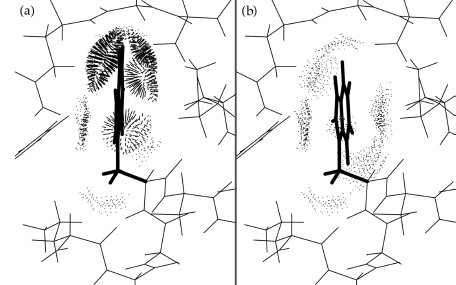
The all-atom method must start off with a reliable way to add hydrogen atoms and optimize their positions, which is done by the program Reduce (Word et al., 1999; Davis et al., 2007); run either separately or as the first step of the MolProbity service. A great many of the hydrogen positions are completely determined by the heavier atoms: methylene H, backbone NH, aromatic H, and so on. The placement of hydrogens involved in OH rotations and His protonation, on the contrary, must be optimized relative to the surrounding structure. Less obviously, the 180° “flip” orientations of Asn and Gln side chain amides (as well as flips of His rings) also need to be optimized; they are fairly often incorrect as deposited, because the N and O atoms of amides or the N and C of histidine rings are not easily distinguished by the experimental X-ray data. However, the choice can reliably be made if both H-bonding and potential clashes of the NH2 are considered (Word et al., 1999b). This process can be done automatically for the user in MolProbity, including kinemage displays that animate between the two alternatives to show the evidence for each change. Figure 15.1a and b shows the two contact displays for a doubly interacting Asn-Gln pair whose H-bonds are equally strong in either flip state. Here, the original choice has an impossibly bad clash with the Gln CaH whereas the flipped state fits well. The flip of a side chain amide is a small change but can be crucial if it affects an H-bond at an active, allosteric, or binding site. The Asn/Gln/His flip corrections are entirely automatic, are highly reliable (Word et al., 1999b; Higman et al., 2004), and do not alter agreement with the diffraction data. Any protein crystal structure could benefit from using this functionality, and a bioinformatics study would be justified in adopting a flipped state with a clear score benefit.
Figure 15.1. Resolving the ambiguity in a pair of doubly H-bonded side chain amides that have four equivalent H-bonds to each other and to waters, in the two best of four possible flip states. Color Figure version shows: H-bonds as pillows of pale green dots), (a) The second-best, but incorrect, flip state (pink side chains), with a large, physically impossible clash of the Gln Ne H with Hα (red spikes at lower left). (b) The correct flip orientation (green side chains), free of bad clashes after exchange of N and O atoms in both amides. From the 1.6Å peroxidase of 1ARU (Fukuyama et al., 1995).
Surprisingly, we have found that most methyl rotations do not actually need to be optimized because they are remarkably relaxed in protein structures, with departures from staggered orientation seldom much above 10°.NH3 groups of lysine or N-termini and side chain methyls of methionine do, however, need rotational optimization. The Reduce program handles nucleic acids and small-molecule ligands as well as proteins, and interactions with individual bound waters are treated by a simplified model. The complexity of the hydrogen addition process is due to the fact that the movable H atoms often occur in interacting H-bond networks and must be optimized as a group rather than individually. In practice, such H-bonding “cliques” are small enough, given our simplified model for water molecules, that exhaustive evaluation of all possible hydrogen positions is computationally tractable. Recent implementation of branch-pruning and other algorithm improvements has sped up the process by 50-fold on average (Davis et al., 2007), usually running in a few seconds, and in less than a minute even on ribosome structures.
All-atom contacts are calculated by the program Probe (Word et al., 1999a) from a Reduce-modified PDB file that now includes hydrogens. The usual output is contact surfaces as color-coded dots in the “kinemage” format for display in the Mage or KiNG graphics programs (Richardson and Richardson, 1992; Davis et al., 2004) as shown in the figures of this chapter, but other display formats, numerical scores, or lists of serious clashes can also be produced. Typically, Probe is run on an entire PDB file, but it can also calculate the internal contacts for a small region or just the contacts between two pieces (i.e., a ligand and a protein), using a flexible command-line syntax of atom selection or a set of check-boxes in the relevant section of the MolProbity site.
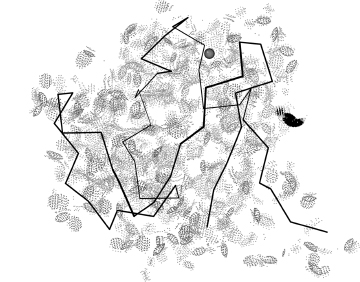
Figure 15.2. Slice through a small section of protein structure showing the relation of all-atom contact surfaces (larger dots) to the atomic van der Waals surfaces (little gray dots) and to the 0.25 Å-radius probe sphere (gray ball) used in the calculation. [Note: This figure should be viewed in the color version, since red versus green color is the primary carrier of information in the all-atom contact representation; color figures also distinguish backbone in white from side chains in cyan, please see supplementary color figures at ftp://ftp.wiley.com/public/sci_tech_med/structural_bioinformatics. The small probe sphere is rolled over the van der Waals surface of each atom, leaving a contact dot only when the probe touches another noncovalently bonded atom. The dots are colored by the local gap width between the two atoms: blue when nearly maximum 0.5Å separation, shading to bright green near perfect van der Waals contact (0Å) gap). When suitable H-bond donor and acceptor atoms overlap, the dots are shown in pale green, forming the lens or pillow shapes of hydrogen bonds. When incompatible atoms interpenetrate, their overlap is emphasized with “spikes” instead of dots, and with colors ranging from yellow for negligible overlaps to bright reds and hot pinks for serious clash overlaps >0.4 Å. Kinemage-format contact dots also carry color information about their source atom (they can be shown with O’s in red, S’s in yellow, and so on); in KiNG or Mage, one can toggle between the two color schemes.
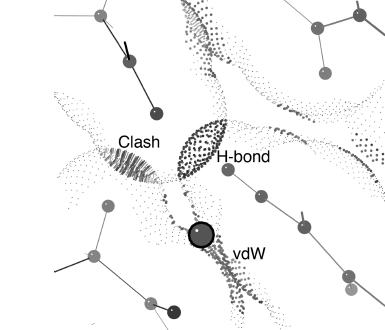
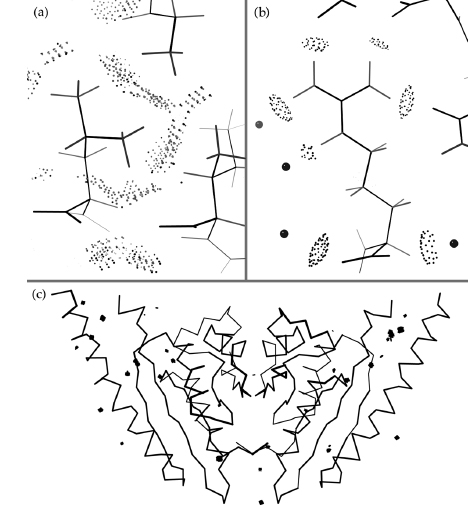
Figure 15.2 illustrates a simple example of all-atom contact surfaces for a small region to show the appearance of favorable vander Waals contacts, favorable H-bond overlaps, and unfavorable atomic overlap, color-coded by the local gap distance between the two contacting atoms. The all-atom contact algorithm rolls a small spherical probe on the surface of each atom, drawing a colored dot only when the probe intersects another noncovalently bonded atom. This is a bit like the inverse of solvent-exposed surface (Lee and Richards, 1971; Connolly, 1983), where only occluded surface is shown; however, our much smaller probe means that only atom pairs within 0.5Å of touching will count as contacts. These contacts are extremely sensitive to fine details of how well the structure fits together. If a local conformation is in the right energy well but not quite correct, it will usually produce just yellow and orange overlap dots. However, it is very difficult to fit anything in a completely wrong conformation without producing red “clash” overlaps, even after refinement has done its best at adjustments. Therefore, the primary way of interpreting the all-atom contact results is simply that lots of soothing green (such as seen in Figure 15.3a and b) means the structure is correct, while an area of red spikes has some sort of problem. In fact, for an all-atom kinemage displayed in Mage or KiNG one can turn off everything but the bad clashes and quickly spot all problem areas even in a large structure, as shown for the 324-residue dimer in Figure 15.3c.
Figure 15.3. All-atom contact examples from the dimer of 1MJH (Zarembinski etal., 1998), a well-determined structural-genomics protein at 1.7 Å resolution. (a) All contacts for one ofthe typically well-packed and well-fit regions of aliphatic side chains, with the green of close van der Waals contacts predominant. (b) All contacts for an ARG side chain, with the five planar H-bonds (lens-shaped groups of pale green dots) of its guanidinium NHs formed either to protein O atoms or to waters (pink balls). (c) An overview ofthe dimer, with only the Ca backbone and the serious clashes >0.4Å(red spikes) shown. When interactively displayed in KiNG or MAGE, it is easy to locate and fix the small number of isolated problems, including two flipped-over HIS rings at the putative active site and a Lys with a high B value factor squeezed into insufficient space between two hydrophobic side chains. This figure also appears in Color Figure section.
In addition to graphical display, several scoring schemes suitable for different purposes produce numerical evaluations of the contact, H-bond, and clash terms. These scores are not energies, however, because the serious clash overlaps represent model errors, not real strains in the structure. When used to understand features of molecular architecture, such as side chain packing, overlaps are treated simply as tight contacts, but for structure validation and error correction purposes, the clash overlaps are very much the dominant issue. We consider a serious clash (one that usually indicates some sort of misfitting) to occur where two incompatible atoms overlap by 0.4 Å or more. The overall “clash score” of a structure is the number of serious clashes per 1000 atoms. For protein structures, the MolProbity web site also produces an overall “MolProbity score,” which is a weighted combination of the clash score with dihedral-angle scores on updated Ramachandran and side chain rotamer criteria. For choosing the best data set example among closely related structures, we currently use the average of the resolution and the MolProbity score as our primary criterion. Other considerations are availability of structure factors, absence of modifications affecting the study, and so on. For NMR structures we have not yet devised a weighted equivalence between density of NMR data and crystallographic resolution; therefore, within a group of similar NMR structures, currently we would use the single model with the best overall MolProbity score.
COMPLEMENTARY RELATIONSHIP WITH MORE TRADITIONAL CRITERIA
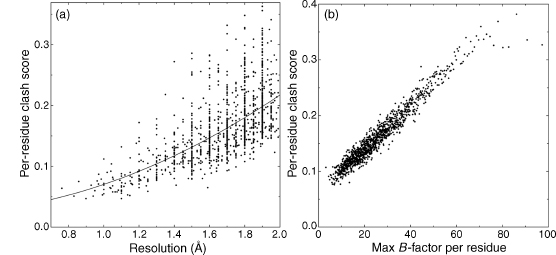
The well-ordered parts of the very best X-ray and NMR structures fit the all-atom contact criteria almost perfectly, with extensive contacts throughout the interior, an absence of even modest clashes, and most atoms showing the green dot patches of ideal vander Waals contact as in Figure 15.3a and b (and, at even higher resolution, in Figure 15.6 below). Such agreement is a strong confirmation that our algorithms and parameters have been chosen reasonably and that the changes recommended by this method go in the right direction. All-atom clash score is strongly correlated with other indicators of structure quality: overall parameters such as resolution or number of NMR restraints correlate with overall clash or MolProbity scores, and both resolution and local crystallographic B-factor correlate strongly with locally measured, per-residue clash score (Figure 15.4a and b).
Another relationship is that different categories of local validation criteria are best used in concert, because a given problem usually shows up in only a subset of them. For instance, if the X-ray refinement terms for geometry were heavily weighted relative to agreement with the experimental data, then the bond angles will not be distorted, but clashes will show; if clashes are between non-H atoms, then refinement may relieve them at the expense of geometry. Model-to-data local accuracy measures (such as real-space correlation) are a highly valuable category for those structures where they are available. The common model-based criteria applicable to all structures fall into three broad categories (with the most powerful measures in each category underlined):
- Geometry: bond lengths, bond angles, planarity, chirality.
- Dihedrals: single-angle preferences, ,ψ angles, side chain rotamers.2
- Sterics: vander Waals, H-bonds, all-atom clashes.
Figure 15.4. Correlation of all-atom clash scores with other indicators of structure quality. (a) Perresidue clash score (fraction of residues with serious overlaps ≥0.4Å , averaged in 1000-residue bins) as a function of resolution, for 5000 representative protein structures between 0.8 and 2.0Å resolution. The relationship is highly significant and is still improving down near 1Å. (b) Per-residue clash score per 1000 residues, as a function of maximum crystallographic B-factor in that residue, for the above 5000 proteins (over a million residues). At low B, less than 10% of residues have a bad clash, while more than 30% do at B ≥60. Clashes level off for the highest B ranges, because those atoms are often exposed at the surface with few neighbors.
We therefore recommend that local structure validation include all four categories when structure factors have been deposited, and all of the last three categories otherwise.
To implement the above recommendation, and to update and extend earlier tools, MolProbity includes new versions of geometrical and dihedral angle quality measures as well as all-atom contact analysis. No early rotamer libraries were quality-filtered at the residue level, and all included at least a few physically impossible rotamers; users should turn either to the Penultimate rotamer library in MolProbity (Lovell et al., 2000) or to the Bayesian library of Dunbrack (Dunbrack, 2002) and their updates.
Similarly, we are all indebted to the original ProCheck Ramachandran criteria that created
the foundations of structure validation, but they were based on the entire unfiltered PDB of 1991 and
have never been updated. Therefore those criteria are not correct in detail, allowing many conformations
that are actually not possible, and flagging as outliers a region with somewhat strained conformation
but adopted by validly fit and functionally important residues at many active sites (see Lovell et al.,
2003). In current PDB file headers, these original ProCheck criteria are used to flag Ramachandran
outliers; it is certainly a very bad sign if there are many of them, but if there is only one and it is
at a functionally important site, then it is most probably correct. The latter Ramachandran analyses on
the EDS site (Kleywegt and Jones, 1996) or in WhatCheck (Hooft et al., 1996) use larger, more accurate
data sets to define accurate core , ψ
regions that encompass 98% of the high-quality data and are very reliable as global evaluations;
however, they do not attempt to distinguish the truly worrisome errors within the remaining 2%. The
MolProbity , ψ scores and distributions
delineate both favored core regions (98% of good data) and disallowed regions (outside 99.95% of good
data). MolProbity also explicitly treats the distributions for Gly, Pro, and pre-Pro as separate cases
(Lovell et al., 2003).
Figure 15.5. Diagnosis and correction of a backward-fit leucine side chain. (a) All-atom contacts for the original side chain, with a substantial clash and an eclipsed χ2 angle. The model fits in the electron density fairly well, but the direction of the tetrahedral branch at Cγ is unclear. (b) Original and refit side chains, showing how both occupy approximately the same space but in opposite orientations. (c) Good all-atom contacts and slightly better density match for the Leu,nowrefit with ideal geometry and a highly favored side chain rotamer conformation. One can be confident that the conformation shown in (c) and not in (a) is in the correct local energy well. Leu 473 from the 1XWL DNA polymerase at 1.7Å resolution (Keifer et al., 1997).
In MolProbity, the rotamer, Ramachandran, and geometry evaluations are used to supplement the novel all-atom clash information to make a robust diagnosis of local problem areas. If structure factors are available, examination of the electron density map in the area of a serious clash usually reveals that the density is either weak or its shape is somewhat ambiguous, making a misfitting more likely than in clearer areas. For example, in a side chain that branches at the Cβ or Cγ (Thr, Val, Ile, or Leu) the electron density fairly often shows a straight bar shape rather than bending at the tetrahedral junction, making it possible to misfit the χ1 angle by 180°. When that happens (as for the Leu in Figure 15.5a), there are nearly always all-atom clashes, the side chain rotamer is an outlier, and for Cβ branches the bond-angle geometry around the Cα is almost always badly distorted through forcing the Cγ atoms to fit into the bar-shaped electron density, although connected to a Cβ that has been fit on the wrong side of the bar. Figure 15.5b shows both the original and the refit leucine side chains, emphasizing the difference in their conformations, though they occupy nearly the same space; Figure 15.5c shows the excellent fit obtainable in a good rotamer with ideal geometry. When this sort of local problem has been clearly identified, a structural bioinformaticist can avoid taking the (probably incorrect) local conformation too seriously, while a structural biologist should refit and re-refine to correct the problem.
Traditionally, electron-density difference maps are used to identify this kind of problem (for instance, sometimes showing a pair of positive and negative peaks at the real and the misfit Cβ). The Uppsala Electron Density Server (Kleywegt et al., 2004; http://eds.bmc.uu.se/eds/) is a valuable source of viewable electron density and difference density maps for those PDB files with available structure factors. For those same files, the EDS also supplies several forms of linear sequence plots of the numerical agreement between the model and the local map (e.g., the real-space correlation function); this gives information similar to the B-factor but more reliably comparable between structures, and it is much easier for a noncrystallographer to interpret than the maps themselves. In contrast, we do not find the estimated uncertainties produced by the Cruickshank, Luzzatti, or Sigma A methods (see Chapter 14) to be a reliable guide, because they only report the uncertainty of an atom position within the density where it was fit and do not reflect the possibility that it was fit in the wrong place. Empirical studies of the coordinate differences between multiple determinations of the same structure typically find actual RMSD values to be four-five times higher than those estimated uncertainties (Kleywegt, 1999).
Local problems in polypeptide chain tracing, such as a sequence out of register by 2 within a β strand, are often flanked at each end by clusters of all-atom clashes and bad bond angles. Neither all-atom contacts nor geometrical ideality is suitable in general; however, for identifying incorrect chain folds, both are too sensitive and too local. This task is probably best done by the sort of “threading” methods used in fold recognition (Chapter 31) and homology modeling (Chapter 30).
In drawing conclusions from a structure or comparison, it seldom matters if one or two parameters are slightly off (e.g., a torsion angle by 15°), but it is often critical if the backbone or side chain is actually in the wrong conformation (e.g., a torsion off by 90-180°) as this will change which atoms are in position to interact, say, with a ligand. Diagnosing such errors, or at least locating places where they are likely, is an important part of structural analysis, and it can be done fairly easily with currently available tools.
USING MOLPROBITY AND RELATED FACILITIES
All-atom contacts, along with the related validation criteria of updated dihedral-angle and geometry evaluations in both global and per-residue forms, can be used in two ways: either online at the MolProbity web site (for user-friendly analysis of one or a few structures) or by scripted command-line runs of the separate programs (for bulk evaluations on large numbers of files). The whole software is available from the kinemage web site free, open source, and multiplatform.
The MolProbity service (Davis et al., 2007) works on coordinate files in either old or new (v3.0) PDB format and on most of the variant formats produced by refinement or modeling programs; the file can either be fetched from the PDB or NDB (Chapters 11 and 12) or uploaded from the user’s computer. For example, on a small, very high-resolution structure such as the 1BRF thermophilic rubredoxin in Figure 15.6, the multicriterion kinemage shows that the all-atom contacts are excellent throughout (green, with some yellow and blue); there are no Asn/Gln/His flips, no rotamer or Ramachandran outliers, and no large geometry deviations. If everything is turned off except the bad overlaps, it is immediately obvious that there is a single serious clash between two surface side chains (a Glu and a Lys). In the electron density, it is clear that both side chains occupy more than one conformation. If the crystallographer is looking at this clash report, he should investigate that region to see if it can be corrected; if abioinformaticist is doing the evaluation, he now knows all of this structure is of extremely high quality except for the two clashing side chains, whose detailed conformation cannot be trusted. This example is a small protein for clarity of presentation in static two-dimensional form, but in an interactive display it is easy to locate the problem regions even on a large, lower-resolution structure and to zoom in and examine them, or else to center on the area of special interest and check for nearby problems.
The two areas in which such clash and dihedral reports have had the greatest impact are both for crystal structures: detecting and fixing protein side chains fit in the wrong rotamer (Arendall et al., 2005) and finding places where nucleic acid backbone conformations are incorrect (Murray et al., 2003; Wang et al., 2008). The most common side chain misfittings are for the Asn/Gln/His flips described above, Thr/Val/Ile/Leu tetrahedral branches (as in Figure 15.5), Met conformations, and Arg guanidinium groups flipped over in their planar density. The reasons for problems with Thr/Val and with Leu are discussed in detail in ref. Lovell et al. (2000); for validation purposes, it suffices to know that these problems occur fairly often and that they almost always produce bad clashes and usually distort Cα-Cβ geometry (Lovell et al., 2003). We expect that quite soon MolProbity will do automatic correction of misfit Leu side chains when structure factors are available; automated diagnosis and correction of this sort of fitting problem is also being built into the PHENIX integrated crystallographic software system (Adams et al., 2002). Met can be difficult because the heavy Sδ atom produces diffraction ripples in the electron density that weakens the information for the nearby Cγ and Cε; all-atom clash and rotamer information can usually make the correct choice clear. Arg side chains have four χ angles and are not easy to fit; therefore, once the guanidinium has been maneuvered into its flat, triangular density, it will usually not be changed either by refinement or by manual rebuilding. However, the guanidinium is asymmetrical, so that its H-bonding and steric clashes with nearby atoms will always be wrong if it happens to fit upside-down. This rather common problem is a real concern for analysis of protein/nucleic acid complexes, because arginines are the most important side chains in such interactions, either for DNA or for RNA.
Figure 15.6. Cα backbone, bound Fe (gray ball), and all-atom contacts for the entire structure of 1BRF rubredoxin (Bau et al., 1998), a small protein structure at 0.95Å resolution. The dense green dot patches (gray in the black-and-white version), signifying well-packed contacts in the molecule and a well-fit model, are seen consistently throughout the structure except for a single, large red (or black) clash between two surface side chains at right. 1BRF thus illustrates both how precisely the all-atom contact criteria are satisfied in atomic-resolution protein structures and also how occasional local errors can be found even in such extremely high-quality structures. This figure also appears in the Color Figure section.
RNA: VALIDATION, STRUCTURE IMPROVEMENT, AND CONFORMER STRINGS
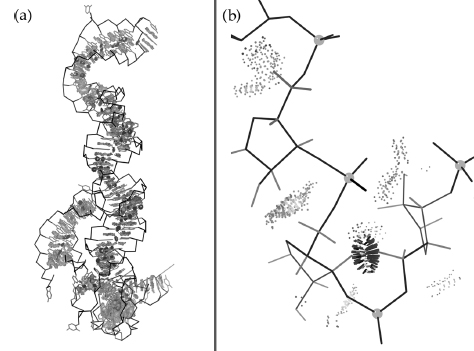
The protein/DNA structures at the basis of genetic control are a very important part of structural biology and bioinformatics (see Chapter 25), and RNA and ribonucleoprotein complex structures are one of the fastest growing areas of novel biological import, including ribosomes, spliceosomes, RNAi, self-splicing introns, and riboswitches (Chapter 33). In nucleic acid crystal structures, the bases are large, rigid, and well determined (Figure 15.7a), and the phosphate density is generally unambiguous, even at the moderate-to-low resolution (2.5-3.5 A) typical of the most biologically interesting structures. In those same structures, however, the rest of the sugar-phosphate backbone has too many rotatable bonds per observable atom and is quite prone to errors when in conformations less well understood than standard B-DNA or A-RNA. H atom clashes, however, mark the incorrect conformations extremely clearly. Figure 15.7b shows all-atom contacts for just the backbone of part of a 5S ribosomal RNA; most areas show excellent contacts, but one residue is in a physically impossible conformation. When analyzing nucleic acid structures, all-atom contacts also provide a quick and pleasing way to visualize the stacking between base pairs (see Figure 15.7a) that are almost always well fit and favorably packed. In RNA, the base pairing, both Watson-Crick and noncanonical, dominates the energetics and specificity of the 3D structure, but the detailed backbone structure is central to RNA catalysis, RNA aptamers, and the specificity of RNA binding to proteins or antibiotics. It is therefore important both to diagnose and correct errors in RNA backbone conformation, and also to help structure analysts evaluate the local accuracy of RNA backbone conformation and of RNA/protein interactions, including arginine/RNA contacts (see above).
Figure 15.7. Base and backbone all-atom contacts in the 5S RNA from the 2.4Å ribosome structure of 1S72 (Klein, Moore, and Steitz, 2004). (α) Base–base contacts, showing the long columns of well-fit base stacking (flat layers of green and blue dots). (β) A section of the backbone–backbone contacts, mostly very nicely packed but with one impossible overlap of C3/and C5/hydrogens (red spikes). This figure also appears in the Color Figure section. and sugar stereochemistry in MCAnnotate (Gendron, Lemieux, and Major, 2001).
Most geometrical validation programs can handle nucleic acid as well as protein bond lengths and angles, and some include other checks such as the noncanonical base-pair types and sugar stereochemistry in MCAnnotate (Gendron, Lemieux, and Major, 2001). MolProbity’s geometrical analysis of whether ribose pucker is likely to be incorrect is a powerful diagnostic tool for misfittings that significantly perturb local backbone and are often accompanied by all-atom clashes and deviant bond angles. Structural biologists can use such diagnoses to guide manual rebuilding, but the multiple variables and constraints in RNA make that process quite difficult. Automated tools are being developed for model building and refitting of RNA, the first of which is RNABC (Wang et al., 2008); such facilities should help improve the level of backbone accuracy in future RNA structures.
Dihedral-angle analysis for RNA is also a rapidly growing area of interest. As for protein
, ψ or side chain rotamers, the RNA
backbone dihedral angles have fairly weak constraints individually but constitute quite powerful
validation criteria when analyzed in combination. The RNA Ontology Consortium has developed a consensus
nomenclature and a list of about 50 distinct RNA backbone conformers found to occur frequently in the
well-ordered parts of high-quality RNA structures (Richardson et al., 2008). These conformers are
described for the suite unit (sugar to sugar) rather than for the nucleotide unit (phosphate to
phosphate), because correlations among the backbone dihedrals are stronger within the suite and it
relates the positions of successive bases. Each suite conformer is given a 2-character name, such as 1a
for A-form or 5z for the start of an S-motif. For an input RNA coordinate file, MolProbity will report
the name (or outlier status) for each suite, along with a conformer-match parameter called “suiteness.”
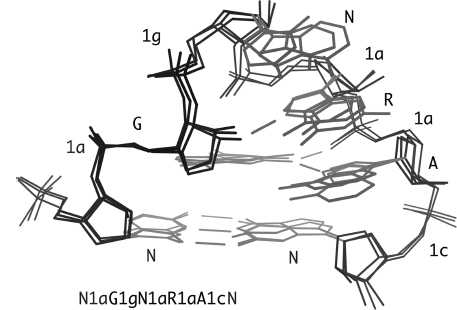
MolProbity also produces a linear string of the RNA conformer names that describe the specific backbone conformation (suite names alternate with base sequence). For instance, the string for the primary strand of an S-motif is N1aN5zA4sG#aU1aA1a. This nomenclature is illustrated in Figure 15.8 for each suite in three superimposed examples of GNRA tetraloops, with the suite string given below. Often, as in this case, the backbone conformation of an RNA structural motif is somewhat better conserved than the base sequence. These suite strings open up new possibilities in structural bioinformatics for adapting sequence-comparison tools to search for RNA structural motifs and to compare structure between RNA molecules at many different scales.
Figure 15.8. Three superimposed GNRA tetraloops from RNA structures, with sugar-phosphate backbone shown dark and bases lighter. The closing Watson–Crick base pair is at the bottom, and lines indicate the three conserved tetraloop H-bonds: one in the non-canonical G–A pair and two base–backbone H-bonds. The two-character suite conformer nameis labeled next to each backbone suite, and the consensus linear suite string of the motif is shown below: N1aG1gN1aR1aA1cN.
USING LOCAL ACCURACY IN BIOINFORMATIC ANALYSES
There are at least four different ways in which all-atom contacts and othermeasures oflocal accuracy can be used to promote stronger and clearer conclusions in structural bioinformatic studies. The first, and simplest, is to filter the reference data by omitting instances with poor local quality measures. Larger samples produce statistically more significant conclusions, other things being equal. However, increasing sample size with instances known to be likely in error will degrade rather than improve the results. For example, high crystallographic B-factors for a protein side chain mean that the electron density was low, smeared out, or otherwise ambiguous and therefore the atomic positions and conformational parameters are poorly determined. Recent side chain rotamer libraries have therefore improved reliability and avoided artifacts by omitting side chains with high B-factors (>40, usually) from their reference data sets (Kuszewski et al., 1997; Lovell et al., 2000; Dunbrack, 2002).
The second strategy is the diagnosis of systematic errors by plotting or otherwise analyzing feature occurrence as a function of quality parameter (e.g., resolution, B-factor, NMR restraints per residue, steric clash score, and so on). True features should maintain or increase relative occurrence frequency as each quality criterion improves, while features that tend to disappear as accuracy improves are highly suspect. Such plots were used to distinguish backward-fit “decoy” Leu rotamers from genuine Leu rotamers (Figure 15.5a of Lovell et al., 2000) and to deprecate the plus α, trans β, minus γ RNA backbone conformer at C3’-endoriboses (Murray et al., 2003). This method is of quite general utility and should be considered for other types of bioinformatic data as well.
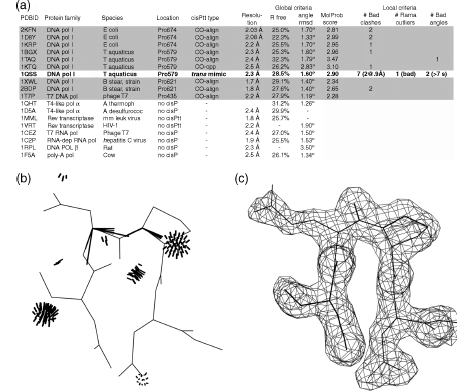
The third strategy is consulting local quality measures to determine whether an outlier in some observed pattern represents a genuine and perhaps informative exception or is simply an error. For example, Videau et al. (2004) examine the conservation within and between protein families for a new czs-Pro turn motif found at a dozen quite different functional sites and very rare elsewhere. In the case of DNA polymerase structures, there is one outlier trans-Pro example (see Figure 15.9a) that breaks the otherwise strong and simple pattern of complete conservation within the bacterial and T7 type I DNA polymerases, where it helps bind the template DNA strand, contrasted with complete absence in all other DNA or RNA polymerases. (Note that this cz’s-Pro motif is thought to be somewhat energetically strained, so that it is rapidly lost once an alternative way of filling its functional role has evolved.) As is often true, global quality parameters are not very helpful here; the outlier example (1QSS, boxed in Figure 15.9a) is in a structure with mid-range or only slightly worse values of resolution, R free, RMSD bond-angle deviation, and even overall MolProbity score compared to the nine other related polymerase structures. No structure factors were deposited for 1QSS, so one cannot evaluate the local fit to electron density in this case, and the local backbone B-factors are not especially high. Fortunately, the model-based local accuracy measures from the MolProbity multichart or multikin give an unambiguous answer, as shown in Figure 15.9b. In 1QSS, the four residues forming the trans-peptide turn at Pro 579 show 10 local validation flags, four of which are very serious: an all-atom backbone-backbone steric clash with overlap of 0.9 Å, a bad Ramachandran outlier, and two bond-angle deviations >7σ, all involving the trans-Pro peptide in question. The equivalent czs-Pro regions in the nine other models show between zero and two validation flags, none of which is strong indicator of backbone problems. Therefore, one can conclude that the trans-Pro turn in 1QSS is an error and the czs-Pro touch-turn is almost certainly conserved across these type I DNA polymerases.
Figure 15.9. Assessing the validity of a pattern-breaking instance in a structural bioinformatic comparison. (a) A new motif called the c/’s-Pro touch-turn is apparently conserved at a DNA-binding site within the type I bacterial and T7 DNA polymerases (shaded), but entirely absent in the more distantly related families. However, the 1QSSTaq polymerase example (bold, unshaded) breaks the pattern with a trans-Pro turn. 1QSS is near average in global quality parameters, but severe local problems stand out unmistakably in the chart. (b) Local stericand angle validation outliers (in black) around the contested peptide in the multicriteria kinemage for 1QSS. (c) In contrast, the cis-Pro touch-turn in 1XWL (Keifer et al., 1997) has no local validation outliers at all, shows the cis peptide CO orientation clearly in the electron density contours (2Fo-Fc at 1.5σ), and adopts the characteristically close, flat contact between thetwo flanking peptides. Overall, then, we can concludethatthe pattern of conservation holds, because the anomalous 1QSS example is almost certainly fit incorrectly (Videau et al., 2004).
The fourth strategy for utilizing local validation criteria, especially all-atom contacts, is in interactive evaluation of whether an individual-residue species difference would be compatible with the known structure of a related comparison molecule. This methodology has been tested out in practice in two different ways: one is to test the suitability of proposed single-site mutations (Ghaemmaghami et al., 1998; Word et al., 2000); the second is to enhance the process of crystallographic model building or model improvement (Richardson, Arendall, and Richardson, 2003; Arendall et al., 2005). This capability is available in a number of different graphics and modeling programs. Two of the most powerful and user-friendly programs for this purpose are KiNG (Davis et al., 2004) and Coot (Emsley and Cowtan, 2004). Both offer side chain mutation, rotamer-guided refitting, interactive update of all-atom contact dots, and display of electron density if available. Coot has a very complete and convenient set of crystallographic tools, while KiNG has interactive report of rotamer quality and a tool called the backrub (Davis et al., 2006) for controlled small backbone adjustments known to occur in mutations or rotamer changes. Either program rapidly solves the problem posed in Figure 15.10a of providing a favorable buried Trp mutation in a domain of λ repressor. If all rotamers of the proposed new side chain showed clashes as bad as Figure 15.10a (even when χ angles and neighboring side chains are adjusted slightly), one would conclude that the replacement was not possible without significant rearrangement of the surrounding structure. However, Figure 15.10b shows excellent contacts around a good Trp rotamer, with optimal fit only 3° away in χ2 and no backrub needed. This Trp mutant was produced and found to have a stability and folding rate at least as good as, and an NMR spectrum very close to, that of the parent λ repressor domain (Ghaemmaghami et al., 1998). In general, if a satisfactory conformation can be found for the mutated side chain, which means the new amino acid can be accommodated without changing anything else, and therefore new properties of the mutant can be ascribed directly to the change of side chain. If no acceptable conformation can be found, the mutation might still turn out to be stable and functional, but it could not be so without the structure rearranging. Predicting the nature of such rearrangements and their functional consequences is currently still beyond the capabilities of even the most sophisticated modeling tools, and so this simple method has given you an answer nearly as good as can be done.
Figure 15.10. A test of alternative sequence possibilities to substitute Trp for Tyr at a buried position in the N-terminal domain of l repressor, using the interactive side chain mutation and refitting functions in MAGE or KiNG. (a) One of the initial rotamer trials (side chain pointing away), with impossibly bad clashes on both sides of the Trp ring. (b) The best of the exact rotamers (side chain toward you), with excellent van der Waals packing (blue, green, and yellow dots), indicating that the Trp side chain can indeed fit without perturbing the structure significantly. Starting coordinates from 1LMB (Beamer and Pabo, 1992). This figure also appears in the Color Figure section.
The all-atom contact tools are also valuable for NMR structures, but that use is less powerful and less straightforward. H atoms are explicitly included already in NMR refinement, and NMR structures are solved in terms of local distances, not absolute Cartesian coordinates. Injudicious application of contact criteria can expand the structure undesirably, but if some models in an ensemble score well and others score badly, the latter are not apt to be correct. One general conclusion from all-atom contact analysis of NMR structures is that for the best-determined cases the interiors excellently fit all-atom criterion and the surface regions would then benefit from a final refinement step with all atoms at 100% radius (rather than the lower percentages often used). All-atom contact analysis is also of considerable use in evaluating theoretical model structures (e.g., Bhattacharya et al., 2007), but again its interpretation is much less robust than when applied to crystallographic structures. A serious clash still means that something must be wrong, but the model with the fewest clashes is not necessarily the most nearly correct.
RELEVANT WEB SITES
http://molprobity.biochem.duke.edu. The MolProbity web site offers global and local quality validation for protein and nucleic acid X-ray or NMR structures: all-atom contact analysis, updated dihedral-angle criteria, and geometrical ideality. Some diagnosed problems can be automatically corrected online.
http://kinemage.biochem.duke.edu. The Richardson lab web site provides multiplat-form, open-source software, selected data sets and libraries, and other resources for MolProbity use, structure improvement, and kinemage graphics.
http://eds.bmc.uu.se/eds/. The Electron Density Server provides electron density and difference density maps, real-space correlation plots, and other crystallographic validation tools that complement the MolProbity criteria.
http://www.ysbl.york.ac.uk/~emsley/coot/. Coot (part of ccp4) is a capable and user-friendly graphics system for crystallographic model building. It utilizes information from MolProbity and can refit with interactive all-atom contacts.
http://phenix-online.org. PHENIX is an integrated package for macromolecular crystallography: phasing, model building, refinement, and validation. The MolProbity criteria are utilized in the automated decision steps.
http://ndbserver.rutgers.edu/. The Nucleic Acid DataBase.
http://www.rcsb.org/pdb/. The Protein Data Bank.