16
STRUCTURE COMPARISON AND ALIGNMENT
INTRODUCTION
Since the 1970s, after the seminal work of Rossmann and Argos (1978) comparing binding sites of known enzyme structures, the comparison and alignment of protein structures has come to be a fundamental and widely used task in computational structure biology. Three main steps are needed for comparing two protein structures: first, the detection of their common similarities; second, the alignment of the structures based on such similarities; and third, a statistical measure of the similarity. Considering the first two steps, structure comparison refers to the analysis of the similarities and differences between two or more structures, and structure alignment refers to establishing which amino acid residues are equivalent between them. The majority of commonly used methods do a reasonably good job in recognizing obvious similarities between protein structures. However, the alignment of two or more structures is a more difficult task, and its accuracy may depend on the method or program used as well as what the user is trying to accomplish, which will be discussed subsequently. All programs that are briefly described in this chapter perform both steps and are commonly known as protein structure alignment methods.
It is also important to immediately clear up any confusion between structure alignment and structure superposition since such terms are often interchanged in the literature. As mentioned above, structure alignment tries to identify the equivalences between pairs of amino acid residues from the structures to superpose, while structure superposition requires the previous knowledge of such equivalences. Thus, structure superposition tries to solve the simpler geometrical task of minimizing the distance between already known equivalent residues of the superimposed structures by finding a transformation that produces either the lowest root-mean-square deviation (RMSD) or the maximal equivalences within an RMSD cutoff. Structure superposition methods have been around for some time (Diamond, 1976; Kabsch, 1976; Hendrickson, 1979; Kearsley, 1989). However, structure comparison and alignment methods, recently reviewed (Carugo, 2007; Mayr, Domingues, and Lackner, 2007), were developed later (Usha and Murthy, 1986; Sali and Blundell, 1990; Boberg, Salakoski, and Vihinen, 1992; Kikuchi, 1992; Shapiro et al., 1992; Holm and Sander, 1993b; Johnson, Overington, and Blundell, 1993; Orengo et al., 1993; Overington et al., 1993; Holm and Sander, 1994a; Lessel and Schomburg, 1994).
We begin this chapter by introducing the use of protein structure comparison and alignment for characterizing a fundamental principle in biology. Then we describe the general approach to structure comparison by outlining some of the most widely used methods. Next, we introduce two particular scenarios involving protein structure comparison, multiple structure alignment and flexible structure alignment. Finally, the large-scale application of methods for protein structure comparison and their impact on characterizing structure space is introduced in the context of structure genomics. As a quick guide, a list of common Internet resources for protein structure comparison and alignment is provided in Table 16.1.
Impact of Protein Structure Comparison and Alignment
Similarly to sequence-based alignment methods, structure-based alignment methods have been widely used for characterizing biological processes. In fact, this book includes a broad overview of several approaches that rely on protein structure comparison and alignment:
- Chapters 17 and 18 introduce two widely accepted structure classification systems, the SCOP (Andreeva et al., 2004) and CATH (Greene et al., 2007) databases. Both efforts result in a hierarchical classification of the known structure space of protein domains.
- Chapter 21 focuses on methods for inferring protein function from structure (Godzik, Jambon, and Friedberg, 2007). In such approaches, structure alignments usually play an important role. Functional inference is relevant to structure genomics, which results in a rapid increase in the number of experimentally determined protein structures of unknown function (Chapter 40).
- Chapters 30 to 32 introduce protein structure prediction and model evaluation, which rely heavily on structure alignment methods for classifying the structure space, assessing the likely accuracy of a model, and/or evaluating its actual accuracy.
Chothia and Lesk (1986) first observed, when the number of structures was limited, that protein structure was more conserved than protein sequence. As such, protein structures can provide protein sequence alignments of an accuracy that would not be achievable from sequence alignments alone. This ability is becoming a major contribution to the field of structural bioinformatics and is best illustrated in the consideration of evolution studied through protein structure (Chapters 17, 18, and 23).
On the Relationship Between Sequence and Structure
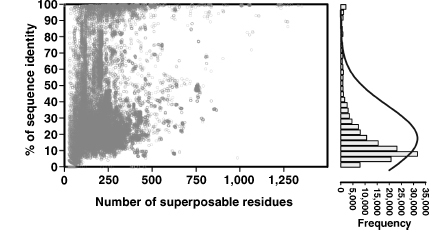
Since evolution conserves protein structure more than protein sequence, it follows that the number of possible structure folds is less than the number of sequence families. How much is implied by “less than” is remarkable. There are a total of 20300 possible sequences of 300 residues, which is more than the number of atoms in the universe. However, evolution has selected a very small subset of those protein sequences (less than 30,000 in human) and an even smaller number of protein folds (1000-5000) (Reeves et al., 2006) (Chapter 2). As stated above, such a reduction from sequence space to structure space was first quantified by Chothia and Lesk in the 1980s (Lesk and Chothia, 1980; Lesk and Chothia, 1982; Chothia and Lesk, 1986; Chothia and Lesk, 1987), later confirmed by Sander and Schneider (1991), and recently updated by Rost (1999). To illustrate this relationship here, we have taken a set of 1000 randomly selected chains from 11,900 nonredundant chains in DBAli (Marti-Renom, Ilyin, and Sali, 2001; Marti-Renom et al., 2007) to generate the plots in Figure 16.1. The data for the plots were obtained from 154,777 pair-wise alignments stored in DBAli, using as a query each of the 1000 selected chains that were aligned by MAMMOTH (Ortiz, Strauss, and Olmea, 2002) against all ~87,000 chains in the Protein Data Bank (PDB) (Berman et al., 2000). Only pair-wise alignments that aligned at least 75% of the Ca atoms of a query structure are plotted. As already observed by Rost (1997), a substantial number of the similar pairs of structures have sequence identities near the values of randomly selected pairs of sequences (~10%). Moreover, Rost assessed that the symmetric shape of the distribution at low sequence identity (<40%) indicates that most sequences are in evolutionary equilibrium making it very difficult to differentiate between convergent and divergent evolution for those sequences. These sequence-structure relationships include the so-called midnight zone (i.e., 0-20% sequence identity) and the so-called twilight zone (i.e., 20-40% sequence identity). The homology between two sequences in the midnight zone is very difficult to determine from sequence methods, and similarity can only be detected using structure alignment methods. Homology can be detected using sequence and/or structure alignment methods in the well-populated twilight zone. In summary, for a large number of evolutionarily related proteins, structure alignments provide valuable insights not achievable from sequence alone.
TABLE 16.1. Popular Internet Resources for Structure Comparison and Alignment
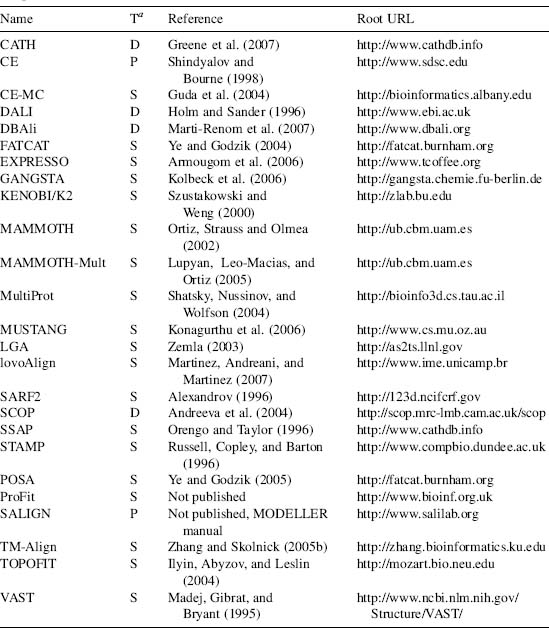
aType: Program (P); Server (S); Database (D).
Figure 16.1. Structure similarity versus sequence similarity. Plotted data was obtained from 159,777 pair-wise structural alignments by MAMMOTH comparing 1000 randomly selected protein chains against the complete structural space deposited in thePDB as of March 2007(~87,000 chains). The 1,000 chains set was obtained from a nonredundant set of structures where alignments between any two chains in the list fails at least one of the following four cutoffs: a minimum of 20% sequence identity, a minimum of 75% of Cα atoms aligned within 4Å, a maximum of 3Å Cα RMSD, and a maximum of 50 residues difference in length. Sequence identity is plotted against the number of superposed residues (left). The frequency distribution plotted against sequence identity with the 159,777 pair-wise structural alignments are shown on the right.
As discussed elsewhere in this book, it is dangerous to consider these findings as absolute—they most certainly are not. The relationship between primary protein sequence, structure, and biological function is complex and still partially uncharacterized. As George Bernard Shaw once said, “the golden rule is that there are no golden rules.” Such a statement clearly applies to what we know from comparing protein sequence and structure spaces. For example, there are cases of structures containing regions of high sequence similarity, and yet sharing no or little structure similarity. Consider that the viral capsid protein (1PIV:1) shares an 80-residue stretch with glycosyltransferase (1HMP:A) where there is >40% sequence identity, yet the structures within those regions are completely different (i.e., mostly β versus mostly α, respectively). In short, structure alignment methods and their results, although only a guideline, have been essential for characterizing the relationship between sequence and structure and its implications in protein evolution.
GENERAL APPROACH TO STRUCTURE COMPARISON AND ALIGNMENT
Structure comparison and alignment is an NP-hard problem, which is only computationally tractable by using heuristics. As a result, the variety of solutions for aligning two protein structures reflect the differences in the heuristics used by each method. Moreover, even if the NP-hard problem were computationally tractable, it is very likely that for pairs of distantly related protein structures, the final alignment would not reveal new biological insights. In fact, for such protein pairs, different structure comparison methods may produce alignments that differ in every position (Godzik, 1996). Thus, it is important to experiment with a different algorithms and to assess the strengths and weaknesses of each method when the quality of the alignment is important to your research. There is a significant body of literature on protein structure comparison and alignment methods to help you in this regard. The reviews listed here are not exhaustive but do provide a historical perspective of the field. In 1994, Orengo comprehensively reviewed a series of methods used in protein structure domain classification (Orengo, 1994). Later on, Gibrat and coworkers reviewed the first structure comparison methods that were fast enough to be effectively used on large numbers of protein structures (Gibrat, Madej, and Bryant, 1996). Lemmen and Lengauer (2000) reviewed the more general field of molecular superposition within drug discovery. The authors provided a perspective on how superposition methods may effectively be used for database screening. In 2001, Koehl highlighted that although protein structure methods were mature enough to be applied in large-scale experiments, it was clear that a reliable score was still needed for assessing the significance of remote structure similarities (Koehl, 2001). Finally, a recent review by Carugo (2007) outlined most of the available methods for pair-wise, multiple, and flexible structure alignment.
In the next section, we outline a few of the most widely used methods for protein structure alignment. However, it is beyond the scope of this chapter to deal with each method in detail, nor to compare them. The intent is to give the reader a sense of the similarities and differences between such approaches. We refer the reader to the original papers for a full description of the methods and the resulting web resources listed in Table 16.1. All methods need to address three problems:
1.Representation: How to represent the input structures in a coordinate-independent space suitable for alignment.
2.Optimization: How to sample the space of possible alignment solutions between the structures.
3.Scoring: How to score a given alignment and determine its statistical significance.
We discuss seven widely used and cited protein structure alignment methods: DALI (Holm and Sander, 1993b), SSAP (Orengo and Taylor, 1996), VAST (Madej, Gibrat, and Bryant, 1995; Gibrat, Madej, and Bryant, 1996), SARF2 (Alexandrov, 1996), CE (Shindyalov and Bourne, 1998), MAMMOTH (Ortiz, Strauss, and Olmea, 2002), and SALIGN (Sali and Blundell, 1990) with regard to how they address the three problems of structure alignment. A broader list of available methods can be found in Table 16.1.
Briefly, the DALI algorithm, which is used in the FSSP database (Holm and Sander, 1994b), aligns two structures by generating a comparison matrix of intramolecular distances and optimizes that matrix using a Monte Carlo procedure. The SSAP algorithm, which is used in the CATH database (Greene et al., 2007), is a method for automatically comparing 3D structures using a double dynamic programming optimizer. The VAST algorithm, which is part of the NCBI’s structure computational services, is a fast similarity search method based on a vector representation of protein structures. The SARF2 algorithm, designed as a similarity search method, compares the spatial arrangements of secondary structure elements computed from the coordinates of proteins. The CE algorithm, also implemented in a multiple structure alignment method CE-MC (Guda, Pal, and Shindyalov, 2006), uses a combinatorial extension (CE) method to extend highly similar pairs of residues, optimizing the best path using dynamic programming (CE) and Monte Carlo optimization (CE-MC). The MAMMOTH algorithm, also implemented in a multiple structure alignment method MAMMOTH-Mult (Lupyan, Leo-Macias, and Ortiz, 2005) and used in the DBAli database (Marti-Renom, Ilyin, and Sali, 2001; Marti-Renom et al., 2007), is a fast method for aligning two structures based on a vector representation of intramolecular distances compared by a dynamic programming optimizer. Finally, the SALIGN command of the MODELLER package (Sali and Blundell, 1993), which is also used in the DBAli database, compares structure properties calculated from the 3D coordinates of two or more proteins that are then aligned by a dynamic programming optimizer.
We now look at each of these methods in more detail according to the three issues associated with comparison.
Protein Structure Representation
DALI uses a distance matrix to represent each structure (Phillips, 1970). Thus, proteins are effectively transformed into 2D arrays of distances between all their Cα atoms. This has the advantage of placing all structures in a simplified common frame of reference. Conceptually, the problem is then straightforward, as if one is imagining each structure’s contact map transparently overlaid. Overlap along the diagonal then represents similar backbone conformations (secondary structure) and off-diagonal similarity in tertiary structure. Moving one sheet of paper horizontally or vertically relative to the other to achieve overlap represents gap insertion into one or other of the structures. A later version of DALI introduced an initial quick lookup of common secondary structure elements (SSEs) between the two proteins.
SSAP (Sequence Structure Alignment Program) uses the Cβ atoms to generate a set of vectors connecting residues (in the case of glycine, a dummy Cβ is used). Such vectors effectively represent the structure in two dimensions providing both position and directionality.
VAST (Vector Alignment Search Tool), as the name suggests, represents structures as a set of vectors. In this case, the vectors are calculated from the secondary structure elements whose type, directionality, and connectivity infer the structure topology of the protein.
SARF2 transforms the coordinate representation in a set of SSEs using the Cα atom of each residue to calculate the deviation of α-helices and β-sheets from typical SSEs conformations.
CE (Combinatorial Extension) represents proteins as a set of Cα distances for octamers (i.e., between eight consecutive residues in the structure). Each pair ofoctameric fragments thatcan be aligned within a giventhreshold is considered an aligned fragmentpair (AFP).
MAMMOTH (MAtching Molecular Models Obtained from THeory) transforms the original coordinates of the protein structure into a set of six unit-vectors calculated from the Ca trace of consecutive heptamers (Chew et al., 1999).
SALIGN represents proteins by a set of properties or features either calculated from their sequences and structures or arbitrarily defined by the user. Such properties are sequence residue type, interresidue distance, fractional side-chain accessibility, secondary structure, local structure conformation, and a user-specified feature.
COMPARISON ALGORITHM AND OPTIMIZATION
DALI creates a set of submatrices of fixed size by collapsing the original distance matrices into regions of overlap. Submatrices are then joined if there is an overlap between adjacent fragments. The optimal superposition of the final matrices is then obtained using the branch and bound algorithm (Holm and Sander, 1996).
SSAP searches for the optimal structure alignment by using a double dynamic programming algorithm. First, a set of selected matching positions is defined by applying a dynamic programming algorithm to the matrix of differences between Cβ vectors of positions i and k (i is the residue index in the first protein and, k is the residue index in the second protein) and all other positions in their respective proteins. Second, the final Sik matrix is obtained by comparing vectors between Cβ atoms at pairs of positions i and j of the same protein to the Cβ atoms from the selected matching positions. The final alignment is then computed over the matrix of scores Sik by a second dynamic programming step.
VAST uses a Gibbs sampling algorithm from seed SSE pairs to find alternative alignments of SSEs and scoring them by comparing the matches with randomly generated sets of SSE pairs. The final alignment is further refined using a Monte Carlo optimization procedure.
SARF2 evaluates pairs of similar SSEs between two structures by comparing the angle between them, the shortest distance between their axes, the closest point on the axes, and the minimum and maximum distances from each SSE to their medium line. SARF2 implements a graph-based optimizer used to solve the maximum clique problem for searching the largest ensembles of the mutually compatible pairs of SSEs. Finally, an extension and refinement of the alignment is computed by adding additional residues to the alignment until a user-defined RMSD threshold is reached.
CE uses a combinatorial extension algorithm to identify and combine the most similar AFPs between the compared structures. Three similarity thresholds guide the heuristic procedure for finding the optimal alignment between two proteins. First, a threshold is used to define a set of AFPs between the two structures and to select the AFP that will seed the structure alignment. Second, an iterative process is used to identify new AFPs to be added to the seed alignment (i.e., with a single AFP in the first iteration). The alignment will be then extended if the addition of a new AFP maintains the alignment score within the second threshold. Finally, a third threshold will be used to identify the best possible alignments within a set of solutions. To speed up the process, new extensions of the alignment will be performed only with AFPs within 30 residues distance to the current alignment ends. Further optimization is performed on selected alignments by using a dynamic programming algorithm over an interprotein distance matrix.
MAMMOTH obtains a similarity matrix between any two heptamers by calculating a URMS (unit-vector root mean square) through optimally superposing their unit-vectors. Then, a dynamic programming algorithm computes the optimal path over the similarity matrix. Finally, a variant of the heuristic implemented in MaxSub (Siew et al., 2000) is used to identify the largest local structure alignment within a given RMSD threshold.
SALIGN computes a dissimilarity matrix between equivalent properties from two or more structures. The dissimilarity score is computed by comparing a weighted sum of the six properties representing the proteins. Then, the final alignment will be obtained by finding the optimal path in the matrix by a local or global dynamic programming algorithm using either an affine gap penalty or an environment-dependent gap penalty function.
Statistical Analysis of Results
DALI computes the statistical significance of an alignment score by using as a background the distribution of scores from an all-against-all comparison of225 representative structures with less than 30% sequence identity (Hobohm et al., 1992). Such a statistic is expressed as the number of standard deviations from the average score derived from the database background distribution (i.e., a Z-score).
SSAP does not explicitly calculate the statistical significance of the SSAP score. However, the scores are empirically calibrated against known structure alignments from the CATH database. Thus, a SSAP score higher than 70 is indicative of topological similarities between the compared structures.
VAST computes a p-value to assess the statistical significance of an alignment score. Such a statistic is calculated in a similar manner to its sequence counterpart, BLAST (Altschul et al., 1990). Thus, the p-value for an alignment by VAST is proportional to the probability that its score can be obtained by randomly aligning SSE pairs. As is also true of BLAST, the considered population of possible solutions weights the final p-value.
SARF2 final alignment score is calculated as a function of the RMSD and the number of matched Ca atoms between the compared structures. The statistical significance of the final score is then obtained by comparing it to the background distributing of scores from aligning the leghemoglobin protein against a set of 426 nonredundant structures (Fischer et al., 1995).
CE computes a Z-score for the final alignment using a set of alignments between representative structures with less than 25% sequence identity (Hobohm et al., 1992). The RMSD and gap score for such alignments are then used to generate normal distributions to calculate the final Z-score of the computed alignment. This normal distribution was later updated with a more realistic extreme value distribution (Jia et al., 2004).
MAMMOTH calculates a p-value statistic to assess the significance of a pair-wise alignment. The p-value estimation is based on an extreme value fitting of the scores resulting from a set of random structure alignments (Abagyan and Batalov, 1997).
SALIGN does not explicitly calculate a statistical significance of the score from the final alignment. Thus, the user is simply presented with the final dissimilarity score obtained by the optimizer. However, when comparing structures, SALIGN returns a quality score, which corresponds to the average percentage of equivalent Ca atoms within 3.5 Abetween all pairs of structures in the alignment.
HOW WELL ARE WE DOING?
Most structure comparison methods will detect global structural similarity between two proteins. However, diverse methods may identify different structure similarity for local alignmnets. Even when local or global similarity can be detected, the details of the sequence alignment derived from structure comparison may differ. Godzik showed that different methods for structure comparison could result in very different alignments for pairs of proteins with low sequence identity (Godzik, 1996). Differences could be so extreme that two methods may result in alignments different at every position. Similar conclusions were obtained comparing several structure classification systems (Hadley and Jones, 1999) or structurally aligning the catalytic core of several protein kinases (Scheeff and Bourne, 2006). Given the heuristics used in protein structure alignment methods, such differences are not surprising. Any method for protein structure alignment needs to balance coverage versus accuracy. In other words, a method may align the core of a protein at very high accuracy (i.e., very low RMSD) and very low coverage (i.e., omitting loop regions), while a second method may prefer to increase the coverage (i.e., include the loop regions in the alignment) to the detriment of accuracy (i.e., increasing the RMSD). How best to address this problem? In part, the answer lies in the question that you wish to address. Certainly, maximizing the biological relevance of a result is going to be the most desirable outcome in the majority of cases. We will come back to this issue at the end, and for now consider the implications of not achieving the optimum biological alignment.
Consider the case of comparing expert hand-generated alignments of protein kinases against those produced by the CE algorithm (Scheeff and Bourne, 2005). CE was unable to reproduce an optimal, manually curated alignment of 18 protein kinase structures of low sequence similarity (<40%; available from http://www.sdsc.edu/pb/kinases). The structures showed significant diversity from the hand-curated set in loop regions as well as in some of their secondary structure elements. A different set of parameters optimizing the alignment of highly conserved regions of the structures might have resulted in more biologically relevant results. In a general application, including large-scale computations, such parameters would have to be optimized for typical families of globular proteins. This requirement makes the production of highly accurate alignments for all protein families in the PDB almost impossible. However, better scoring functions that incorporate structure and functional information about a particular family may help the development of more accurate methods.
SAMPLE RESULTS FROM STRUCTURE COMPARISON AND ALIGNMENT
Consider three examples that illustrate the importance of protein structure comparison and alignment for characterizing and quantifying structural and functional similarities between apparently unrelated proteins.
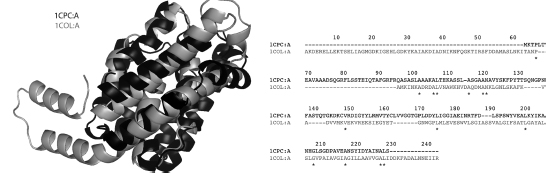
The first example, shown in Figure 16.2, corresponds to the alignment between a membrane protein (colicin A; 1COL:A) and an accessory pigment to chlorophyll (c-phycocianin; 1CPC:A). On first glance, the function of these proteins is very different. Colicin A forms voltage-gated channels in the lipid bilayers of membranes, whereas phycocianin is a pigment from the light harvesting phycobiliprotein family. Holm and Sander (1993a) detected a surprising similarity between these two folds with six α-helices sequentially aligned (Figure 16.2). Such a discovery implies that both sequences had undergone convergent evolution to form a stable 3-on-3 α-helical sandwich fold. Interestingly, it was subsequently discovered that phycocianins can aggregate forming clusters that then adhere to the membrane forming the so-called phycobilisomes. Such a functional relationship may indeed point to convergent evolution from a distant common ancestor.
Figure 16.2. Structure alignment for c-phycocyanin (1CPC:A) (black) and colicinA (1COL:A) (gray) as computed by SALIGN. The alignment extended over 86 residues with a 0.97Å RMSD. The sequence identity of the superposed residues with respect to the shorter of the two structures was 11.9%.
The second example, which is extracted from the work of one of our groups (Tsigelny et al., 2000), illustrated how the combination and integration of different sources of information, including structural alignments, could help to functionally characterize a protein. In our work, two new EF-hand motifs were identified in acetylcholinesterase (AChE) and related proteins by combining the results from a hidden Markov model sequence search, Prosite pattern extraction, and protein structure alignments by CE. It was also found that the α-β hydrolase fold family, including acetylcholinesterases, contains putative Ca2+binding sites, indicative of an EF-hand motif, and which in some family members may be critical for heterologous cell associations. This putative finding represented the second characterization of an EF-hand motif within an extracellular protein, which previously had only been found in osteonectins. Thus, structure alignment had contributed to our understanding of an important family of proteins.
Finally, the third example, also from a previous work of one of our groups (McMahon et al., 2005), combined information from structural alignments deposited in the DBAli database and experiments to analyze the sequence and fold diversity of a C-type lectin domain. We demonstrated that the C-type lectin fold adopted by a major tropism determinant sequence, a retroelement-encoded receptor binding protein, provides a highly static structural scaffold in support of a diverse array of sequences. Immunoglobulins are known to fulfill the same role of a scaffold supporting a large variety of sequences necessary for an antigenic response. C-type lectins were shown to represent a different evolutionary solution taken by retroelements to balance diversity against stability.
MULTIPLE STRUCTURE ALIGNMENT
Our discussions thus far have involved only pair-wise structure comparison and alignment, or at best, alignment of multiple structures to a single representative in a pair-wise fashion (i.e., progressive pair-wise structure alignment). Most of the available methods for multiple structure alignment start by computing all pair-wise alignments between a set of structures but then use them to generate the optimal consensus alignment between all the structures.A characteristic of all multiple structure alignment methods is that not all the pair-wise alignments used in the multiple alignment may be optimal. Once computed, multiple structure alignments, which encode weak yet definitive sequence relationships, can be used as seed alignments for iterative searches of the nonredundant sequence databases to derive hidden Markov models (HMMs) or profiles for use in fold, family, and superfamily annotation.
Several methods have been developed for the alignment of multiple structures (Table 16.1). Here, we briefly outline three different methods: CE-MC (Guda et al., 2001; Guda et al., 2004), MAMMOTH-Mult (Lupyan, Leo-Macias, and Ortiz, 2005), and SALIGN (Madhusudhan et al., unpublished).
CE-MC (combinatorial extension-Monte Carlo) refines a set of pair-wise structure alignments using a Monte Carlo optimization technique. That is, the algorithm iteratively modifies the multiple alignment, initialized with pair-wise alignments of a master structure against all other structures, by a random set of moves, which are then accepted with a probability proportional to the gain in the alignment score. The iterative process is stopped when the optimal alignment, which is based on a defined distance score for each block of aligned residues across the alignment, cannot be improved by random moves. Initially two specific families, protein kinases and aspartic proteinases, were tested and compared against manually curated alignments and those from the HOMSTRAD database (Stebbings and Mizuguchi, 2004). CE-MC improved the overall number of aligned residues while preserving key catalytic residues for those families. Using a larger benchmark of 66 protein families, on average, an additional 12% of residues was observed to be aligned.
MAMMOTH-Mult is an extension of the MAMMOTH algorithm used for pair-wise structure alignment. The alignment starts by generating all pair-wise alignments. An average linkage procedure is then used to cluster all structures based on their pair-wise structural similarity, resulting in a dendrogram tree. MAMMOTH-Mult then generates a multiple structure alignment by iteratively aligning, in a pair-wise fashion, the branches of the dendrogram that are closest to each other. The authors demonstrated that the method, which produces a typical multiple alignment every 5 s of a single CPU, produced more accurate alignments compared to other previously existing multiple structure alignment methods (Lupyan, Leo-Macias, and Ortiz, 2005).
SALIGN can be applied to align three or more protein structures using two different approaches, a tree-based or a progressive alignment. Similar to MAMMOTH-Mult, during the tree-based alignment, a dendrogram representing all pair-wise structural relationships is calculated to guide the multiple structure alignment. SALIGN first aligns the two most similar structures in the dendogram, which are then treated as a unit and aligned to the next closest structure or group of structures. This iterative process is finished when SALIGN reaches the root of the tree. Alternatively, if progressive alignment is chosen, the structures are gradually aligned in the order they are input to MODELLER. The progressive alignment method is computationally less intensive than using a tree-based approach.
FLEXIBLE STRUCTURE ALIGNMENT
Flexible structure alignments are becoming increasingly important given our increased understanding of protein fold space, which moves away from the notion of discrete folds to more of a densely populated continuum (next section). A logical outcome of the continuum model is that protein domains are difficult to delineate and that it is better that structure be considered as sets of suprasecondary structures (i.e., continuous or discontinuous small numbers of SSEs). In this model, the differences between related protein structures may lie in the relative orientation of such subdomain protein fragments.
Current methods for protein structure comparison and alignment cannot address subtle changes in the angle between those protein fragments. Ye and Godzik have developed a method for flexible structure alignment called FATCAT (Ye and Godzik, 2003; Ye and Godzik, 2004) and applied it to identify structural similarities in database searches. Briefly, the FATCAT algorithm adds a limited number of “twists” between AFPs (i.e., aligned fragment pairs between the two structures), which are treated as rigid bodies. Thus, the final score is proportional to the alignmentscore forhavinganumberofAFPs in the alignment and the “penalty” of including twist to join the AFPs. In addition, FATCAT will allow twists that result in a decrease of the RMSD. Dynamic programming is used to refine the final alignment based on the similarity matrix upon superposition of the AFPs resulting from the first step. The authors demonstrated that FATCAT produced more accurate alignments when using a test set of multidomain proteins. The FATCAT algorithm has been applied broadly to produce the Flexible Structural Neighborhood database (Li, Ye, and Godzik, 2006).
MAPPING PROTEIN FOLD SPACE
Ever since the first protein structures were experimentally determined, researchers have attempted to divide and classify them. The most recent view of the protein structure space introduced proteins as combinations of subdomain fragments, which in turn result in a structurally dense and continuous description of the fold space (Haspel et al. 2003; Kihara and Skolnick 2003; Tendulkar et al. 2004; Friedberg and Godzik, 2005a; Friedberg and Godzik, 2005b; Zhang and Skolnick 2005a). It has even been suggested that these fragments may be evolutionary linked to ancestral peptides in an RNA-based world (Lupas, Ponting, and Russell 2001; Soding and Lupas 2003). However, the most accepted view of protein structures divides them into domains (Chapter 20). Domains are considered evolutionary units to the extent that they can be excised from the chain and yet continue to fold correctly with a well-defined hydrophobic core, often still exhibiting biological activity (Rossman, 1981; Holm and Sander, 1996). Given this view, domains can then be considered a particular representation of recurrent and independent protein fragments that may be observed in different folds or environments. Thus, proteins with similar folds could be described as proteins sharing similar arrangement of protein domains or fragments (Ye et al., 2003).
Independently of how domains (or structural units) are defined (Holland et al., 2006), what seems clear today is that the protein fold space is quite dense and continuous. With the exception of nonglobular proteins, such as membrane and disordered proteins, the PDB may already contain most of the recurrent structural units (Kihara and Skolnick, 2003). However, the sequence diversity possible using those recurring structural units is by no means represented in the PDB. The gap between known sequence and structural space is one of the main driving forces behind structural genomics (Chapter 40) as well as a major limitation for complete coverage of large-scale comparative structure prediction methods.
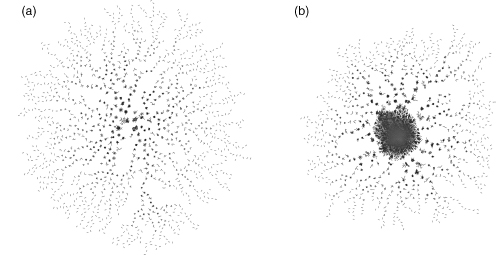
The SCOP (Murzin et al., 1995; Andreeva et al., 2004), DALI (Holm and Sander, 1996; Holm and Sander, 1999), and CATH (Orengo et al., 1997; Greene et al., 2007) databases made the first comprehensive attempts to map protein structure space at the domain level.These three classification systems use a somewhat different definition of a domain and hence differences in classification result (Day et al., 2003). This clearly reflects the difficulty of uniquely defining a domain (Chapter 20). Given the notion of a more continuous protein fold space than previously suspected, it may be more profitable to characterize structures at the level of the sub-domain. Indeed, we can find plenty of references to recurrent subdomain structures in the literature such as greek-key, jelly-roll, β-propeller, α-solenoid, and so on, which are well accepted yet not systematically defined. The challenge then becomes identifying the proper resolution of a map that is needed to solve the problem at hand. One of our groups, using the structural alignments stored in the DBAli database, has made an attempt to visually map the continuity and density of structural space at subdomain resolution. As of August 2007, the DBAli database contained ~1.67 billion pair-wise structure alignments calculated by MAMMOTH. Using these comparisons, we have created a map of the structural relationships between all members of our nonredundant set of 11,900 PDB chains (see Figure 16.1 for details about this set). In this map, two protein chains (vertices) are linked (edges) if at least 40% of their Ca atoms can be superimposed within 4 A and result in an alignment of at least 40% or 20% sequence identity (Figure 16.3a and b, respectively). Effectively, the resolution of such maps corresponds to aligning fragments of approximately 50 residues. At such resolution, it is the sequence discontinuity that separates protein fold space. More specifically, when the sequence identity threshold is as low as 20%, 4679 of all nonredundant chains are joined into a single largest cluster. This means that for ~40% of the vertices in the map, a path can be found by linking superposed fragments of at least 50 residues. However, such continuity completely breaks by increasing the sequence identity threshold to 40% resulting in 10,121 clusters and only ~ 1% of chains forming part of the largest cluster. Similar observations were already reached by one of our groups (Shindyalov and Bourne, 2000). In that work, we clustered groups of structures based on theresults ofan all-against-all comparison withthe CEprogram. Suchclustering resulted in a highly repetitive set of superposed substructures not detectable by sequence similarity alone. We observed as well that for some chains, different substructures constituted all or parts of well-annotated folds. We concluded that mapping protein fold space using such substructures could be useful for finding remote sequence homology and predicting the structure and function of proteins (Friedberg and Godzik, 2005a; Friedberg and Godzik, 2005b).
Figure 16.3. Map of protein fold space. Two protein chains (vertices) are linked (edges) if at least 40% of their Cα atoms can be superposed within 4Å and result in an alignment of at least 40% or 20% sequence identity for panels a and b, respectively. (a) Map at 40% sequence identity of the 11,900 nonredundant set.Atotal of 2530 clusters withtwoormore structures are shown. The largest cluster in the map contains 115 chains. The map does not show the 7591 singletons remaining after clustering. (b) Map at 20% sequence identity of the 11,900 nonredundant set. A total of 1521 clusters with two or more structures are shown. The largest cluster in the map contains 4679 chains. The map does not show the 2924 singletons remaining after clustering. Both maps were produced with the LGL program (Adai et al., 2004) and rendered by the lgl2ps script (Fred P. Davis).
In summary, if the protein fold space is a continuous and dense territory, then many different and systematic definitions of recurrent fragments are possible. It is important to stress the need to carefully identify and define the appropriate level of resolution for answering the biological question to be addressed. In short, there are great opportunities for original thinking in defining the structural units relevant for characterizing protein structure evolution. With the advent of structural genomics, this opportunity is even more pronounced.
THE IMPACT OF STRUCTURAL GENOMICS
The motivation for improved protein structure comparison, alignment, and characterization is currently defined quite simply by quantity—the rate of increase in the number of experimentally determined new folds and the number of structures adopting each fold. A recent review by Carugo (2007) already highlights the sudden increase in automatic methods for structure comparison and alignment. Such methods require not only high accuracy and coverage but also fast execution to cope with the increasing number of structures. Automation should seek to reach the quality of human annotation, since no expert is able to keep up with rate of growth of the PDB. The increase in the number of structures is, in part, due to a move toward high-throughput structure determination. Despite some recent controversy about the cost and impact of structural genomics (SG) (Chandonia and Brenner, 2006; Levitt, 2007; Liu, Montelione, and Rost, 2007; Petsko, 2007), it seems fair (at least to us) to say that the technological advances accomplished by the SG consortia have increased the success rate of structure determination while decreasing the cost per structure. At the time of writing (August 2007), the PDB contained 5129 deposited structures from the SG consortia with a rate of more than 800 per year being added over the past 4 years. About half of those depositions were for structures with sequences that shared, at the date of submission, less than 30% sequence identity to any other known structure in the PDB. Such structures are then used for computationally predicting the structure of all their known homologous sequences. For example, the New York Structural GenomiX Research Consortium has deposited 426 structures in the PDB from which the ModPipe computational package (Eswar et al., 2003) was able to predict 575,035 fold assignments and 56,302 reliable 3D models (i.e., ~130 protein structure predictions per new released structure). The reader can visit http://targetdb.pdb.org for up-to-date detailed statistics about the SG deposited structures in the PDB (Chen et al., 2004).
It is important to note that an increase in deposited structures does not just imply quantity, but also variety, complexity, and singularity. In recent years, the rate of deposition of complex and nonglobular structures deposited in the PDB has also increased. This trend is likely to continue. The Protein Structure Initiative (PSI) responsible for structural genomics in the United States has recently approved its second phase of funding to four of its original pilot centers as well as six new specialized centers, including two centers dedicated to membrane proteins. Therefore, traditional laboratories as well as those within the SG consortia will likely continue to increase the number and variety of predicted and determined structures deposited in the PDB or modeling databases such as ModB ase (Pieper et al., 2006). One of the major challenges will be to characterize the functions of a growing number of deposited structures with unknown function. In particular, biologists will be faced with the problem of characterizing the intricate network of interactions between single and multiple domain proteins. Diverse sources of information will be needed for tackling such challenges. For example, high-resolution protein-protein interactions can be characterized by fitting known or modeled structure into a lower resolution structure map of a complex, which could be determined by cryoelectron microscopy (Topf and Sali, 2005).
THE FUTURE
Protein structure comparison and alignment is a well-studied area as the Wikipedia page http://en.wikipedia.org/wiki/Structural_alignment_software will attest. The field is plagued by problems that afflict other areas of bioinformatics—lack of use of benchmark datasets, papers without available software, and minor advances over previous efforts. Notwithstanding, a significant understanding of the problem has been reached and methods continue to improve. We point to some of what we believe are still open challenges for protein structure comparison and alignment:
- Accurate and Fast Methods for Multiple Structure Alignment: Existing methods for multiple structure alignment are reaching unprecedented levels of coverage and accuracy. However, some of the most accurate methods are still computationally prohibitive to be applied in large-scale and continuous experiments.
- Flexible Structure Alignment: While significant progress has been made, biological features that depend on flexibility have yet to be considered as part of the alignment procedure; for example, difference between open and closed states of an enzyme induced by cofactors present in the structure and known allosteric interactions.
- Biologically Relevant Alignments: Current methods for structure comparison and alignment usually focus on optimizing geometrical similarities between two or more structures. However, function is not always related to geometrical features and chemical, physical, or evolutional information can help in finding the most relevant alignment between structures. Thus, methods that are able to account for additional biological information might lead to more accurate alignments. Rather than align a set of amino acids based solely on their 3D atomic coordinates, alignments will include a variety of parameters that reflect secondary, tertiary, possibly quaternary features, and functional features of the structures under study. This will require significantly better annotation of structures than exist today if this is to be done in a high-throughput mode.
- Automatic Optimization ofParameters: Related to the points raised above, new methods that identify optimal parameters for each protein family would likely result in a larger number of accurate alignments.
- Clustering and Classification: Currently, the PDB contains more than 90,000 protein chains. A full set of comparisons requires that approximately 4 x 10⁹ comparisons be computed and stored. This is overwhelming for all but the fastest algorithms and extensive computer clusters. As a result, compromises are made by introducing various types of redundancy to reduce the number of computations to be made, thereby losing important information. Faster and more biologically meaningful clustering and classification algorithms are needed.
- Biologically Relevant Division of the Structural Space: Defining and identifying unique structural units that are recurrent between protein structures remains an unresolved issue. Domains and subdomains are currently used, but more fine-grained features may be needed.
- Leverage of Structure Alignments: During the last decade, we have seen the development of several methods for fast and reliable pair-wise structure alignment. Some of such methods have been applied in large-scale comparison of all-against-all structures in the PDB. However, such alignments, which are then normally deposited in databases, are barely used outside of the groups that generated them. A double effort is needed to make the data easily accessible to other developers as well as to develop new computational methods that leverage the benefits of such databases.
The ever-increasing number of structures and the scientific insights that structure comparison and alignment can bring to classification, functional understanding, provision of powerful search tools (e.g., HMMs seeded by structure alignments) and so on will see continued efforts to meet these challenges and guarantee that structure comparison and alignment will remain an active area of research in years to come.
ACKNOWLEDGMENTS
We thank Dr. Fred P. Davis for the Perl script to render LGL output graphs. MAMR and EC research is supported by the European Union (Marie Curie Program FP6-039722), the Spanish Ministerio de Educacioon y Ciencia (BIO2007/66670), and the Generalitat Valenciana (GV/2007/065).