7
STUDY OF PROTEIN THREE-DIMENSIONAL STRUCTURE AND DYNAMICS USING PEPTIDE AMIDE HYDROGEN/DEUTERIUM EXCHANGE MASS SPECTROMETRY (DXMS) AND CHEMICAL CROSS-LINKING WITH MASS SPECTROMETRY TO CONSTRAIN MOLECULAR MODELING
INTRODUCTION
As more genomes are fully sequenced, there is a shift in interest to explore the intricate interplay of proteins in complex pathways and to study how protein structures vary in the course of these myriad interactions. While many high-throughput structural genomics programs seek to address these problems, it is apparent that producing structural models of protein complexes and large multidomain proteins using conventional techniques can be a slow process taking many months to years. Size limitations in NMR and the ability of a protein or protein complex to crystallize are the greatest hurdles. These bottlenecks have encouraged research into alternate approaches for structure determination such as mass spectrometry based techniques and examination of chemically cross-linked proteins.
While mass spectrometry has not been traditionally viewed as a structure determination tool, advancements in MS techniques in combination with molecular modeling have opened up an entire new field in high-throughput structure determination. One such approach is enhanced peptide amide hydrogen/deuterium exchange mass spectrometry (DXMS) that focuses on liquid chromatography-mass spectrometry (LC-MS) based determination of these exquisitely informative exchange rates. When the technique is taken to its limit, single amide level resolution of exchange rates is possible. These values, one for each amide (amino acid) in the protein, reflect the accessibility of solvent water to each peptide amide hydrogen in the protein, with access provided by native state fluctuations in the structure of the protein. Thus, these measurements can directly report the thermodynamic stability of the entire protein at the resolution of single amino acids. With appropriate methodologies, these measurements can be achieved with small amounts of large proteins, without the need for protein crystallization or undue concentration.
Three examples of probing protein structure/dynamics via DXMS are presented here. We first describe DXMS investigation of conformational changes of the manganese transport regulator (MntR) in solution upon binding divalent transition metal ions. Metal binding rigidifies the protein and therefore reduces the entropic cost of DNA binding. Second, we describe how PAS (Per-Arnt-Sim) domain allostery and light-induced conformational changes in photoactive yellow protein (PYP) upon I2 intermediate formation were probed with DXMS. Finally, we show the structural basis for the binding of anthrax lethal factor to oligomeric protective antigen is elucidated by DXMS analysis.
Another emerging technique takes advantage of the ability of chemical cross-linking reagents to provide distance constraints for pairs of functional groups within a protein or between interacting proteins. This hybrid biochemical/bioinformatics approach derives distance constraints from chemical cross-linking experiments to be used in molecular modeling. The technique uses high-accuracy mass spectrometers to locate the exact insertion site of chemical cross-links that can be used as sparse distance constraints for quick and inexpensive low-resolution structure prediction. While cross-linking has been used for many years identifying interacting proteins, it has been the advancement in mass spectrometry techniques (Mann and Talbo, 1996) that has made this technique appealing for structural determination studies. The accuracy of current mass spectrometers and the fragmentation capability allow the identification of the exact insertion point (Chen, Chen, and Anderson, 1999; Pearson, Pannell, and Fales, 2002; Dihazi and Sinz, 2003; Kruppa, Schoeniger, and Young, 2003). The cross-linking technique is able to remove size limitations imposed by both NMR and crystallography (for large complexes), as only proteolytic fragments are analyzed.
In this chapter, we also introduce the techniques used for structure determination using chemical cross-linking and molecular modeling. We highlight current available cross-linking reagents and mass spectrometry techniques. While it has been proven difficult to identify cross-linked peptides from a forest of native species, we introduce innovations in cross-linker design and new analysis techniques that have greatly improved their identification. Finally, examples that effectively use chemical cross-links for structure prediction when combined with molecular modeling/docking (Young et al., 2000; Mouradov et al., 2006) are demonstrated. This hybrid biochemical and computational technique can be used to quickly and inexpensively obtain low-resolution structure prediction.
Principles of Mass Spectrometry
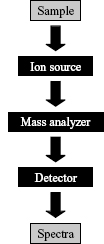
Mass spectrometers have been an integral part of analytical science since first invented in 1918, with applications ranging from identifying unknown compounds to determining structure of compounds based on fragmentation. This is carried out by measurement of the mass-to-charge (m/z) ratio of the ionized forms of the molecules of interest. While many types of mass spectrometers have been developed in recent years, they all consist of three basic components: an ion source, a mass analyzer, and an ion detector (Figure 7.1).
The analyte is often subjected to extensive processing before ion generation. Protein or peptide samples can be proteolyzed, and then subjected to liquid chromatography, typically employing reverse-phase (hydrophobic) supports, with proteins/peptides applied to the column in aqueous solution, and acetonitrile gradient-eluted molecules continuously directed to the ion source.
The ion source ionizes (either positively or negatively) molecules in the sample. The two most common ion sources are electrospray ionization (ESI) and matrix-assisted laser desorption/ionization (MALDI). Electrospray ionization sprays the analyte (dissolved in a volatile solvent) from a small, highly charged capillary into gas (typically nitrogen) at approximately atmospheric pressure. The charge density on the aerosol microdroplets greatly increases as the solvent evaporates, driving a process called Coulombic fission, which eventuates in rapid and repeated droplet fission and evaporation, with the charge efficiently transferred to analyte ions in the gas phase. The aerosol is generated in close proximity to a pinhole-sized “leak” in the mass spectrometer, through which ions are drawn into a relatively high-vacuum regime and then directed to the mass analyzer.
In MALDI ionization, the analyte is first placed on a plate within the high-vacuum regime, and then ionized by a pulsed laser beam. “Matrix molecules” are typically mixed with the analyte, before it is dried onto the MALDI plate. The matrix facilitates ionization of the analyte and protects the biomolecule from being fragmented by the laser beam. It is hypothesized that the matrix is first ionized, with the transfer of a part of their energy to the analyte, in turn ionizing it. It should be noted that ESI typically produces multiply charged ions, while MALDI produces primarily single charged ions.
Figure 7.1. Schematic showing the three basic components that all mass spectrometers contain (black boxes). The sample is first ionized and then separated according to m/z. Finally, all m/z ratios are recorded and combined into a spectrum.
Mass analyzers separate the ions according to their m/z ratio using either static or dynamic fields with a combination of either magnetic or electric fields. One of the most common analyzers is time-of-flight (TOF) that measures time taken for a charged particle to reach the detector (after acceleration from an electric field). Lighter particles with the same charge will reach the detector before heavier particles.
A quadrupole mass analyzer works as a mass filter, transmitting one ion at a time based on its m/z ratio. Over time, the analyzer goes through a specified mass range that in turn creates a mass spectrum. A quadrupole ion trap works in the same manner, but it has the capability to trap ions and then eject them sequentially according to their m/z ratio.
In recent years, a high-resolution and precision mass analyzer was developed in the form of Fourier transform ion cyclotron resonance (FTICR) mass spectrometry. It uses the cyclotron frequency of the ions in a fixed magnetic field to measure the m/z ratios. The ions are injected into an electric/magnetic ion trap (called a Penning trap) where they are bent by the magnetic field into a circular motion in a plane perpendicular to the field and excited to a larger cyclotron radius by an oscillating electric field, as the original radius of the motion is too small to be detected. The resulting signal is called a free induction decay (FID) and consists of a complex frequency versus a time spectrum containing all the signals. By deconvoluting this signal using a Fourier transform allows the conversion of the composite signal to m/z values for each constituent ion contributing to the spectrum.
Multiple steps of mass analysis can be carried out using tandem mass spectrometry. The most common use of this is for peptide fragmentation. In this process, the first mass analyzer selects ions to be fragmented (precursor masses), while the second mass analyzer allows for fragmentation by collision-induced dissociation (CID). CID fragments molecular ions by allowing them to collide with neutral gas molecules (helium, nitrogen, or argon). Finally, the third analyzer separates the fragmented ions to allow the measurement of their m/z.An example of this is a MALDI-TOF/TOF mass spectrometer, where a CID is separated by two TOF analyzers.
The mass spectrometer’s final element detects the arrival of an ion at a precise location and time, and from this information the m/z of the ion can be calculated. Combining all recorded m/z for all ions detected in the sample produces an m/z spectrum for the sample.
Modern mass spectrometers are powerful enough to resolve masses to within several parts per million. Differences in mass of less than 1 Da are readily resolved. The constituent atoms of peptides naturally exist as mixtures of isotopes of varying weights, and thus a spectrum derived from a specific peptide does not have a single m/z, but consists of a closely clustered group of ions that differ in mass by the equivalent of 1 Da. This cluster of masses for the peptide is termed the isotopic envelope.
H/D Exchange Chemistry
Amide hydrogens can be exchanged with solvent hydrogen through either acid-, base-, or water-catalyzed reactions (Bai et al., 1993):
(7.1)
At low pH, the acid-catalyzed reaction dominates, while the rates of the base-catalyzed reactions increase at higher pH values. The water-catalyzed reaction is independent of pH. Given the temperature dependence of exchange rates, the slowest exchange rates at room temperature are observed at about pH 2.7. Much higher exchange rates are observed near neutral pH, where the amide hydrogen exchange reaction is mostly base-catalyzed.
The exchange rate of peptide amide hydrogens reflects its precise and unique environment within the protein’s three-dimensional structure, and there is one such hydrogen for each amino acid in the protein, except for proline. A backbone amide hydrogen can exhibit highly variable exchange rates with solvent hydrogen, with rates ranging over eight orders of magnitude in folded proteins (Engen and Smith, 2001). In contrast, amide hydrogen exchange rates in peptides lacking secondary and tertiary structure vary only about 100-fold, depending primarily on neighboring amino acid side chains (Bai et al., 1993).
The exchange kinetics of amide hydrogens can be followed by deuterium isotope labeling with exchange times ranging from seconds to days. The exchange rates of hydrogens on —OH, —SH, — NH2, —COOH, and —CONH2 groups and the amino and carboxy termini are much faster. Carbon-centered hydrogens do not exchange under normal conditions and undergo isotope substitution only following activation by chemical treatment, such as reaction with hydroxyl radicals (Goshe and Anderson, 1999).
Several features affect the rate of amide hydrogen exchange, including participation in hydrogen bonding (Hilser and Freire, 1996), distance from the protein surface (Resing, Hoofnagle, and Ahn, 1999), and the flexibility of the peptide chain (Zhang, Post, and Smith, 1996). The degree of retardation in amide hydrogen exchange rate that results from the amide’s physical environment is termed its “protection factor” (pf):
(7.2)
where kex is the observed exchange rate and kch is the “intrinsic” exchange rate calculated at a given pH and temperature in unstructured peptide chain (Bai et al., 1993).
H/D Exchange Thermodynamics
Formalisms to relate the observed rates of amide hydrogen exchange to thermodynamic stabilization of proteins have been developed (Englander and Kallenbach, 1983). Amide hydrogens of proteins in the native, folded state are proposed to exchange according to the following equation:
(7.3)

where kop is the rate at which amide hydrogen converts from closed state to open state and kcl is the rate amide hydrogen converts from open state to closed state. For most proteins at or below neutral pH, amide H/D exchange occurs by an EX2 mechanism (Sivaraman, Arrington, and Robertson, 2001), where kcl ;>> kch. In EX2 condition, Eq. 7.4 can be simplified as
(7.5)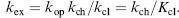
The closing equilibrium constant at each amide (Kcl = kcl/kop) is equal to the protection factor (pf) and can be translated into the stabilization free energy of closed state (ΔGcl) by Eq. 7.6:

Therefore, the ratio of measured H/D exchange rates in the folded protein (kex) and the calculated“intrinsic” rates (kch) can be converted into the free energy of a midehydrogenata given condition. Thus, the measurement of exchange rates of backbone amide hydrogen serves as a precise thermodynamic sensor of the local environment.
H/D Exchange for Protein Structure and Dynamics
Frequently, the hydrogen exchange rates of two or more physical states of a protein, such aswith and withouts protein binding partner (here represented by kex + and kex—), are measured to locate stabilization free energy changes upon the perturbation (ΔG -→ +):
(7.7)
The change in free energy upon protein binding (ΔG -→ +) can be monitored by H/D exchange rates.
OVERVIEW OF DXMS METHODOLOGY
Dramatic advances in mass spectrometry and improvements in the various steps within the experimental hydrogen exchange procedures have resulted in the development of automated systems for high-throughput, high-resolution H/D exchange analysis (Woods Jr, 1997; Woods Jr, 2001a; Woods Jr, 2001b; Woods Jr and Hamuro, 2001; Pantazatos et al., 2004). The system (Figure 7.2), described in this section, incorporates the latest of these enhancements, including solid-phase proteolysis, automated liquid handling, and streamlined data reduction software (Hamuro et al., 2003a; Hamuro et al., 2003b; Black et al., 2004; Hamuro et al., 2004)
H/D Exchange Reaction
To initiate an H/D exchange reaction, a protein sample, initially in nondeuterated buffer, is incubated in a buffer with 50-90% mole fraction deuterated water. There are almost no restrictions on reaction conditions that allow exchange behavior to be studied as a function of protein and buffer composition, solution pH, and in the presence and absence of ligands. To follow the deuterium buildup of individual amide hydrogen or sets of hydrogens, several on-exchange time points are sampled for each condition.
Figure 7.2. Overall H/D exchange experiment.

Quench of Exchange Reaction
Following incubation in a deuterated environment for a defined interval, the exchange reaction is “exchange quenched” by diluting the protein sample with a cold, acidic solution (pH ~ 2.5 and 0°C). The quench conditions significantly slow the amide exchange reaction and limit undesirable back exchange. Subsequent experimental procedures are conducted near the quench conditions to minimize the loss of incorporated deuterium.
Protein Fragmentation by Proteolysis
To localize the rate of deuterium buildup to specific amides, the analyte protein is fragmented into a collection of peptides using combinations of endo- and exoproteases. Due to the low pH of the quench conditions in which the protein and peptide samples are maintained after deuterium labeling, the acid-reactive proteases such as pepsin must be employed. Studies with combinations of acid-reactive endoproteinases and carboxypeptidases have been employed to achieve greater sequence coverage and higher amide resolution (Englander et al., 2003; Woods Jr and Hamuro, 2001).
Digestion Optimization
The digestion conditions are optimized prior to conducting multiple H/D exchange experiments, to ensure high sequence coverage. Calculation of the differences in deuterium content between overlapping peptides is the preferred method to localize incorporated deuterium atoms (Hamuro et al., 2002a). Variable digestion parameters include the type and bed volume of the protease columns, the transit time of the protein over the protease column, the type and concentration of denaturant (Hamuro et al., 2002a), and the inclusion of reducing reagents such as tris(2-carboxyethyl)phosphine hydrochloride (TCEP) (Yan et al., 2002).
HPLC Separation
The peptides generated by proteolysis are separated using reverse-phase HPLC to minimize mass overlap and ionization suppression caused by ion competition in the electrospray source (Woods Jr, 1997). The optimized LC gradient parameters efficiently separate peptides while minimizing loss of deuterium through back exchange with solvent. Increased sensitivity can be achieved by using capillary HPLC columns and nanoelectrospray methods (Wang and Smith, 2003).
Mass Analysis
The majority of reported H/D studies employ quadrupole ion-trap (QIT) instruments due to their ease of use, excellent sensitivity, ability to perform MS/MS experiments, compact size, and low cost. Other reports discuss the use of instruments with higher mass resolving power such as the hybrid QTOF instruments (Wang and Smith, 2003). A few groups have utilized FTICR mass spectrometry, which offers ultrahigh mass-resolving power and improved mass accuracy (Akashi and Takio, 2001; Lanman et al., 2003).
Automation of H/D Exchange by MS
A fully automated system for performing detailed studies has been developed to improve the reproducibility and throughput (Figure 7.2) (Hamuro et al., 2003a). It consists of two functional components: a sample deuteration device and a protein processing unit. The preparation operations (shown at the top of Figure 7.2) are performed by two robotic arms equipped with low-volume syringes and two temperature-controlled chambers, one held at 25°C and the other at 1°C. To initiate the exchange experiment, a small amount of protein solution is mixed with a deuterated buffer and the mixture is then incubated for a programmed period of time in the temperature-controlled chamber. This on-exchanged sample is immediately transferred to the cold chamber where a quench solution is added to the mixture. The exchange-quenched solution is then injected onto the protein processing system that includes injection loops, protease column(s), a trap column, an analytical column, electronically controlled valves, and isocratic and gradient pumps. The injector, columns, and valves reside in a low-temperature chamber to minimize the loss of deuterium by back exchange (Figure 7.3). The quenched protein solution is pumped in series through a column containing an immobilized protease and a trap column to capture the peptide fragments. The gradient pump is activated following digestion and the peptides captured on the trap column are eluted and separated over an analytical reverse-phase HPLC column directly into the mass spectrometer.
Figure 7.3. Diagramof a fully automated systemfor acquiring H/D exchange MS data starting with a stock solution of the nondeuterated protein. In this system (Hamuro et al., 2003a), the liquid handler mixes a small amount of concentrated protein solution with a selected deuterated buffer and the mixture is incubated for a programmed period of time. The exchange reaction is conducted in a temperature-controlled chamber held at 25°C. The mixture is then transferred to an acidic quench solution held at 1°C. After quenching the exchange reaction, the entire sample is injected onto an LC–MS system that includes injection loops, protease column(s), a trap, an analytical column, and isocratic and gradient pumps. The injector, columns and electronically controlled valves reside in a low-temperature chamber to minimize the loss of deuterium by back exchange. The quenched protein solution is pumped in series over a column containing the immobilized protease and a reverse-phase trap to capture the peptide fragments. The gradient pump is activated following the digestion and the peptides captured on the trap are eluted into the mass spectrometer after separation in the analytical column.
Automated Data Analysis
A software system capable of extracting and cataloging the large number of data points obtainedduringeachexperimenthas been developed(Hamuro etal., 2003a). Theautomated system streamlines most data handling steps and reduces the potential for errors associated with manual manipulation of large data sets. In the first processing step, the centroid mass value is obtained for the isotopic envelope of each peptide ion observed in every LC-MS data file associated with the experiment. This step includes peak detection, selection of retention time window, selection of m/z range, and calculation of envelope centroid. The second step involves correction for deuterium losses subsequent to sample quench with reference to measured peptide-specific losses (Hamuro et al., 2003a; Zhang and Smith, 1993). After calculating the percent deuterium incorporation for each peptide at each time point, H/D exchange data are displayed in a number of formats, often as a stacked bar chart that is aligned with the protein sequence.
EXAMPLES OF APPLICATIONS OF DXMS
DXMS Analysis of Conformational Changes of the Manganese Transport Regulator
The Manganese Transport Regulator of Bacillus Subtilis. Manganese transport regulator (MntR) is a metalloregulatory protein found in Bacillus subtilis,a member of the iron-responsive diphtheria toxin repressor (DtxR) family (Que and Helmann, 2000). MntR responds to Mn2+ and Cd2+ by binding to cognate DNA recognition sequences and repressing the mntABCD and mntH operons, and forms a stable, metal-independent homodimer in solution. Crystallographic studies (Glasfeld et al., 2003; Kliegman et al., 2006; DeWitt et al., 2007) show that MntR consists of two domains: the N-terminal domain containing a winged helix-turn-helix (HTH) motif involved in DNA binding, and the C-terminal domain that contains the dimerization interface. The overall conformations of MntR in the various metal-bound forms are almost identical, with only minor structural variations between the mobile region and the metal binding sites, which exhibits mononuclear (Zn2+ and Co2+) or dinuclear (Mn2+, Cd2+ , and Ca2+ ) metal active sites for metal-loaded structures.
DXMS was used to compare the solution structure of apo-MntR and holo-MntR to identify regions affected by metal binding and to elucidate how the formation of the binuclear metal site contributes to the mechanism of metal-mediated activation for DNA binding of this protein. In addition, comparison of exchange rates between apo-Mnt R, Mn2+ -bound, Cd2+ -bound, and Co2+ -bound forms of MntR is used to reveal the solution dynamics of MntR.
DXMS Experimental Methods Employed with MntR. Deuterated samples were prepared at 25°C by diluting 20 LiL of protein stock solution with 60 LiL of deuterated buffer (Hamuro et al., 2002a; Hamuro et al., 2002b; Hamuro et al., 2003b; Woods Jr, 2003), followed by “on-exchange” incubation for various times (10,30,60,150,600,3600,14,400, and 86,400 s) prior to quenching in 120 LiL quench buffer (0.8% formic acid, 13.3% glycerol, and 6.2 M guanidine hydrochloride (GuHCl)) at 0°C, and were stored frozen at —80°C. The frozen samples were then thawed at 0°C before passing over an immobilized pepsin column at 100 L L/min with collection of proteolytic products by a reverse-phase C18 column. Subsequently, the C18 column was eluted with a linear gradient of 4-36% acetonitrile over 30 min. The eluate was electrosprayed directly into the mass spectrometer and MS data were analyzed using specialized DXMS software to determine the number of deuterons incorporated with each fragmented peptide.
DXMS Analysis of MntR. The N-terminal DNA binding domain (1-62) of MntR showed less protection than the C-terminal (83-142) dimerization domain, while the linker region between N- and C-terminal domain (65-80) showed intermediate protection. However, in regions affected by metal binding (11-15, 65-80, 93-111), holo-MntR shows different H/D exchange pattern when compared with apo-MntR. Peptides 11-15 and 65-80 show more protection in Co-Mnt R, and even more protection in Cd-MntR and Mn-MntR. In the dimer interface region (93-111), Cd-MntR and Mn-MntR also show more protection than either apo-MntR or Co-MntR.
Dynamics of MntR in Solution. The DXMS behavior of apo-MntR suggests that the N-terminal domain, containing the HTH DNA binding motif, shows more conformational flexibility in solution than the C-terminal dimerization domain, which is consistent with crystallography studies (Glasfeld et al., 2003; Kliegman et al., 2006). Well-protected regions (11-15 and 30-32) in DNA binding domain are involved in hydrophobic interactions and further in metal-mediated DNA binding. We also saw protection of helix 5 (86-91) and helix 6 (114-116) in the dimer interface region, suggesting that a hydrophobic core was formed to initiate dimer formation. Biophysical studies have confirmed that apo-MntR exists as homodimer in solution (Lieser et al., 2003). The interhelix interaction of helix 7 (118-141) implies that this region is also involved in dimer formation.
The comparison between the DXMS behavior of apo-MntR and holo-MntR can map the conformational changes associated with metal binding. The deuteration levels of three segments in MntR (11-15, 65-80, and 93-111) were significantly lower in the presence of metal ions, suggesting that these regions were involved in the metal binding and dramatically rigidified upon metal binding. In addition, these regions showed even more protection in Cd-MntR or Mn-MntR than that in Co-MntR, consistent with their coordination geometries. Cd-MntR and Mn-MntR formed a binuclear metal site within MntR, while in the case of Co-MntR, a mononuclear metal site was formed.
Mechanism of Metal Activation. Based on the result that strong protection was observed on helices 1, 4, and 5 in response to metal binding, a mechanism was proposed that the metal binding event solidifies the MntR structure to constrain the high mobility between the DNA binding and dimerization domains. The lack of deuteration changes between apo-MntR and holo-MntR for the DNA binding domain implied that the mechanism of activation does not involve large conformational changes, but rather a structural rigidification upon metal binding. Since the DNA binding motif in apo-MntR is preformed, the protein can readily bind DNA once the metal binding event restricts the interdomain motion. In such a context, the mechanism of DNA binding activation of MntR relies on reducing the mobility of a preorganized protein via metal binding.
DXMS Analysis of PAS Domain Allostery and Light-Induced Conformational Changes in Photoactive Yellow Protein Upon I2 Intermediate Formation
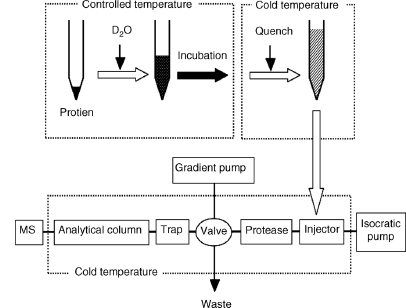
Photoactive Yellow Protein I2 Intermediate. Photoactive yellow protein, asmall bacterial photoreceptor protein that exemplifies the PAS domain superfamily of sensors and signal transducers, is a 125-amino acid residue cytosolic blue light receptor from the purple bacterium Halorhodospira halophila and presumably serves as the sensor for negative phototaxis (Cusanovich and Meyer, 2003; Hellingwerf, Hendriks, and Gensch, 2003). PYP adopts an a/p fold (Figure 7.4) with a central six-stranded antiparallel p-sheet flanked by α-helices on both sides and covalently binds a negatively charged /p-hydroxycinnamic acid chromophore with Cys69 via a thioester linkage. Upon absorption of blue light (lmax = 446 nm), PYP undergoes a light-activated reaction cycle that starts with early intermediates I0 and I1, via long-lived intermediate I2 that represents the biologically important signaling state, and returns to the ground state or dark state.
The PYP fold represents the structural prototype of the PAS domain (Pellequer et al., 1998) found in diverse multidomain proteins, mediating protein-protein interaction andfunctioningas sensors andsignaltransducers. ThePAS/PYPfoldcanbedividedintofour segments: (i) the N-terminal cap (1-28), including α-helices 1 and 2; (ii) the PAS core (29-69), including p-strands 1-3, intervening α-helices 3 and 4, and a short π-helix, (iii) the helical connector (70-87), consisting predominantly of the long helix α5; and (iv) the β-scaffold (88-125), containing β-strands 4-6.
Figure 7.4. PYP fold and active-site hydrogen bonding network. The chromophore (Chr) and active-site residues that participate in a hydrogen bonding network (dotted lines) are shown with bonds. The chromophore forms hydrogen bonds with its thioester oxygen to the backbone amide group and with its phenolate oxygen to the side chains of Tyr42 and Glu46. The side chain of Thr50 is in hydrogen bonding distance to the hydroxyl group of Tyr42 and the main- chain carbonyl oxygen of Glu46. Arg52 forms hydrogen bonds to the backbone carbonyl oxygens of Thr50 and Tyr98 by its guanidinium group and shields the chromophore from solvent. N- and C-termini are labeled (PDB ID: 2PHY).
In PYP crystallographic structures, light-induced conformational changes are localized near the chromophore binding site. During I2 formation, the phenolic ring of the chromophore rotates out of the binding pockets via the disruption of dark-state hydrogen binding network and becomes protonated and solvent accessible. Additional structural and dynamic changes have also been observed with various biophysical techniques (NMR, FTIR, CD, etc.).
DXMS was used to reveal the detailed protein conformational and dynamic changes upon I2 formation. As a result, an allosteric tense (T) to relaxed (R) state transition observed in PYP was proposed to provide a general mechanism and pathway for signal transduction directed by the conserved structures of the PYP/PAS module.
DXMS Experimental Methods Employed with PYP. Deuterated samples were prepared as above, except that during deuterium exchange, the samples were either kept in the dark (for dark-state samples) or illuminated with >400 nm light for accumulation of the I2 intermediate. The subsequent sample processing was as mentioned earlier.
DXMS Analysis of PYP Dark State and I2 Intermediate. Fifty-seven high-quality identical peptides were obtained for both PYP dark state and I2 intermediate that cover the entire PYP sequence without any gaps. The H/D exchange map for the PYP dark state (Figure 7.5a) shows that adjacent segments with similar H/D exchange rates delimit the four regions defining the PYP/PAS module. Residues 1-27 show high H/D exchange rates that correspond with the solvent-exposed PYP/PAS N-terminal cap. Residues 28-73 have very low H/D exchange rates that map to the conserved PAS core. Residues 78-88 in the helical connector show intermediate H/D exchanges rates corresponding to the long helix α5. The remaining C-terminal segments (88-125), corresponding to β-scaffold of PYP/PAS module, exhibit exchange rates reflecting their secondary structural elements. In strand p4 (91-96), single-residue resolution highlights a pattern of alternative fast and slow H/D exchange, showing strong protection provided by hydrogen bonding between p4 and p5.
Figure 7.5. Amide H/D exchange for the PYP ground state (a) and the I2 intermediate (b). Each block represents protein sequence segments defined by overlapping peptides and consists of four time points (from top: 30, 300, 3000, and 30,000 s). The deuteration levels of each such segment at each time point are shown by different colors from blue (<10% deuteration) through red (>90% deuteration), as indicated in the figure. Residues 1–2, 16, 76–77, and 98 are not covered by any sequence segment. The secondary structure elements are shown on top of the protein sequence; a stands for a-helix, b for b-sheet. Figure also appears in the Color Figure section.
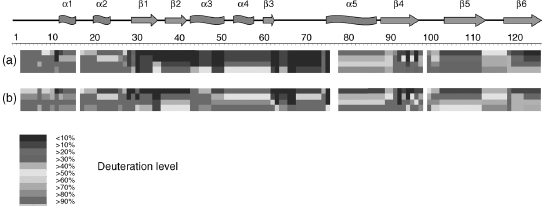
For I2 intermediate, although PYP remains stable, overall deuterium incorporation is ~ 17% higher than for the dark state. The largest increases in H/D exchange for I2 are focused on the chromophore binding site (43-73), where less protection is observed from strand β2 to the connector helix (Figure 7.6). The most significant decreases in H/D exchange are found in the PYP N-terminus: residues 3-5, 6, 7, and 10 become more protected in I2. Significant changes are also found at the junction of the N-terminal cap and strand β1 (less protection), residue 34-35 (more protection), and strand β4 (less distinct alternating protection pattern). The C-terminal end and N-terminal cap show less changes between the dark state and I2 intermediate. Changes in H/D exchange kinetics between the dark state and I2 state were also examined (Figure 7.6).
Figure 7.6. Average deuteration changes upon I2 state formation mapped on PYP structure. Average deuterium incorporation changes upon I2 formation from Figure 7.4 are mapped on the PYP ground-state ribbon diagram colored from-75% to +75% change according to the color bar. α-Helices 1–5, β-strands I–VI, and N- and C-termini are labeled. The chromophore and activesite residues Tyr42 and Glu46, which form hydrogen bonds (green dotted lines) to the phenolate oxygen of the chromophore in the ground state, are shown for better orientation as well. Figure also appears in the Color Figure section.
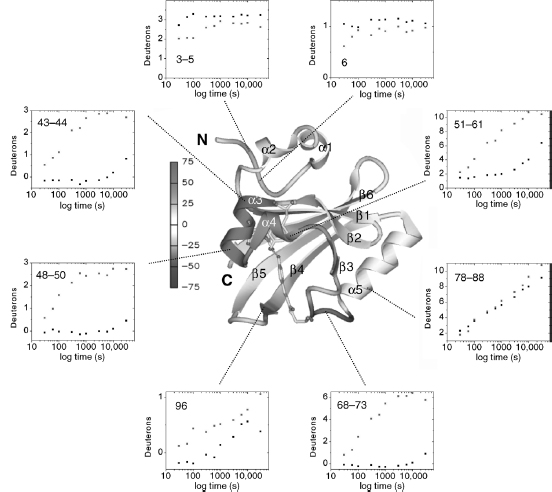
Integrating Structural Changes in PYP Upon I2 State Formation. The DXMS results reveal conformational and dynamic changes in PYP upon light-activated I2 intermediate formation in solution. During I2 formation, the largest deuteration increases are found in the continuous stretch of residues 43-73 (Figure 7.6), which spans from α-helix 3, contributing to the hydrogen binding network, short β-strand 3 and the overlapping n-helix, to chromophore-bearing Cys69. The increased H/D exchange rates for segments around the chromophore binding site (43-44, 48-50, 51-61, 68-73) illustrate the relaxation of PAS core via trans-cis isomerization of the chromophore, disruption of the active-site hydrogen binding network, and loss of the dark state. The overall pattern of H/D exchange rates in this region suggests a breathing mode, in which the n-helix remains attached to the β -sheet, while preceding helices α3 and α4 become less hydrogen bonded and more solvent exposed. Overall, the connections between PAS core region and the rest of PYP dark state structure are weakened upon I2 formation. The light-activated conformational and dynamic changes at the chromophore binding site subsequently propagate through the PYP protein to the p4-p5 hairpin, the p-sheet, and the N-terminus.
Mapping the Signaling Pathway. By combining our DXMS results with cryst-allographic structures, we can map the following signal transduction pathways for PYP:
PAS Core α-Helices: The pathway for destabilization of the PAS core started from αhelix 3, which exhibits highest increase in deuteration for PYP during I2 formation. The increased flexibility and unfolding of helix a3 propagate to neighboring segments β2, α4, and β3, as seen from deuteration increases encompassing residue 36-62. DXMS analyses also show the release of the central PAS core from its connections to the rest of the PYP structure, as well as the release of α3 from the N-terminal cap.
β-Hairpin: In the β4-β5 hairpin, the connecting loop (97-102) and the C-terminal end of edge strand β4 (89-96) are affected by the movements of the neighboring chromophore. Significantly altered deuterium incorporation shown in residues 92, 94, 96, and 99 upon I2 formation reflects the disruption of the dark-state hydrogen bonding network between β4 and the chromophore binding site, where large increases in deuteration were also observed.
β-Sheet Interface: DXMS results show that the β-sheet relaxes and becomes less distorted and more regular in the I2 intermediate on one side of the p-sheet. However, the first seven N-terminal residues, opposite end of the p-sheet from the chromophore, show a significant decrease in deuteration upon I2 formation. This is in good agreement with the N-terminal truncation experiments (Harigai et al., 2001; Harigai et al., 2003), where the N-terminus is important for tuning the lifetime of the I2 state and catalyzing PYP recovery.
Allosteric Transition: Based on the above results and analyses, we propose that PYP/ PAS module undergoes an allosteric transition, switching between two conformations (tense and relaxed states) for signaling. The versatile PYP/PAS module can propagate a conformational signal in three directions: through the PAS core helices, the β-hairpin, or the β-sheet interface.
Structural Determinants for the Binding of Anthrax Lethal Factor to Oligomeric Protective Antigen
Anthrax Lethal Toxin. Three toxin components, that is, edema factor (EF), lethal factor (LF), and protective antigen (PA), secreted by Bacillus anthracis, the causative agent of anthrax, assemble at the host cell surface to form a series of toxic, noncovalent complexes. Toxin assembly begins when PA binds to a cell surface receptor (Bradley et al., 2001; Scobie et al., 2003) and is enzymatically cleaved into N-terminal fragment (PA20) that dissociates into the media and a C-terminal fragment (PA63) that heptamerizes to form the prepore ((PA63)7). LF binds to oligomeric forms of PA63 via its homologous N-terminal ^250-residue domain (LFN) to generate the toxin complex (LF-PA) that is then internalized into acidified compartments. This internalization converts an existing prepore conformation into a membrane-spanning pore, allowing LF to be translocated across the endosomal membrane to the cytosol.
Previous mutagenesis studies (Cunningham et al., 2002; Lacy et al., 2002) showed that a small convoluted patch of seven residues formed on the surface of LFN constituted the binding site for PA, while the site on PA was found to span the interface between two adjacent subunits of oligomeric PA. This result suggested that additional residues on LFN may also be involved in binding to PA. DXMS is applied to identify regions within LFN that are involved in binding to PA. Findings show that four regions of the primary structure displayed protection from solvent in the presence of PA. These regions form a single continuous surface on LFN that is in contact with PA. Further mutagenesis study revealed the mechanism and binding interface of LF to oligomeric forms of PA.
DXMS Analysis of LFN Alone and LFN -PA63 Complexes. One hundred fifty-five fragmented peptides were obtained and collectively covered most of the LFN sequence, except for the first ~60 residues that produce highly positively charged species that are difficult to identify in the mass spectrometer. The results of H/D exchange of LFN in the absence of PA are mapped onto the crystal structure of LFN (Figure 7.7). Most of the peptides derived from the surface of LFN showed increased deuteration at various stages of exchange, whereas the core regions (148-61, 213-22) showed little changes. The lack of deuteration within the central core helices indicates that LFN has a rigidly folded nucleus under native conditions.
Figure 7.7. Pepsin fragmentation and H/D exchange behavior for LFN. (a) Pepsin digest coverage map of LFN. Each black line represents one of the 155 peptide fragments that were identified, analyzed, and used in this study. (b) Ribbon diagrams of LFN (residues 27–263 of LFN; PDB entry 1J7N) showing the degree of deuterium content incorporated at three different time points. The level of deuteration for each peptide is colored according to the following scheme: blue,<33% deuterated; yellow, 33–67% deuterated; red, >67% deuterated. This figure was generated using Chimera (Pettersen et al., 2004). Figure also appears in the Color Figure section.
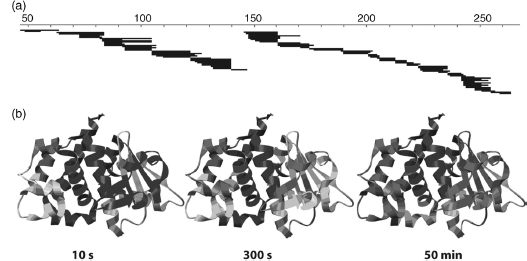
Figure 7.8.
Deuterium uptake for LFN in the absence and presence of PA. (a) The mass
spectra of a peptide corresponding to residues 223–235 in the absence (left) and presence
(right) of PA. In the absence of PA, the centroid of the peaks increases steadily, whereas in the
presence of PA, the centroid of peaks does not shift significantly. Gray lines are arbitrary
reference points used to visualize the peak shift. Data from spectra were then used to calculate the
deuterium content for LFN peptides in the absence (•) and presence of PA
( ) over six time points. Data are fit
to the sum of double exponentials and shown for LFN alone as a dashed
red line, and for LFN þ PA as a solid blue line. (b) The average percent
difference in deuterium content over the six time pointswas plotted for representative peptides that
spanned the LFA sequence. Positive values are taken to represent decreases in deuterium uptake in
the presence of PA, relative to the absence of PA. The four sites with significant decreases in
deuterium uptake in the presence of PA, denoted as DX sites 1-4, are colored blue, green, yellow,
and red, respectively. (c) Surface representation of the proposed binding surface of LFN with the four DX sites (1-4) identified by H/D exchange colored in
blue, green, yellow, and red, respectively. Figure also appears in the Color Figure section.
) over six time points. Data are fit
to the sum of double exponentials and shown for LFN alone as a dashed
red line, and for LFN þ PA as a solid blue line. (b) The average percent
difference in deuterium content over the six time pointswas plotted for representative peptides that
spanned the LFA sequence. Positive values are taken to represent decreases in deuterium uptake in
the presence of PA, relative to the absence of PA. The four sites with significant decreases in
deuterium uptake in the presence of PA, denoted as DX sites 1-4, are colored blue, green, yellow,
and red, respectively. (c) Surface representation of the proposed binding surface of LFN with the four DX sites (1-4) identified by H/D exchange colored in
blue, green, yellow, and red, respectively. Figure also appears in the Color Figure section.
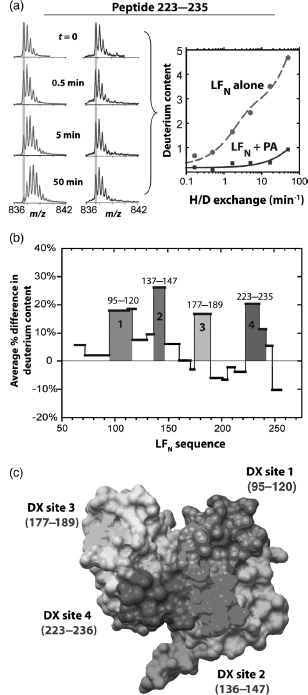
Because of the inherent tendency of LFN-PA heptamer complexes to aggregate at high concentrations, the PA dimer is selected as an alternative binding partner for LFN. When two mutated forms of PA that are oligomerization deficient are combined in the presence of LFN,a ternary complex is formed. DXMS results of the ternary complex showed that four discrete sites inLFN (i.e., DX site 1, 95-120; DX site 2, 137-147, DX site3, 177-189, and DX site 4, 223-235) became significantly more protected from solvent exchange in the presence of PA (Figure 7.8). When mapped onto the surface of LFN, these four sites converged to form a continuous surface that is larger than that previously implied by mutagenesis studies (Lacy et al., 2002) that only covered DX sites 3 and 4. To address the role of the two additional sites identified here, we constructed a series of mutants within and near these regions and tested their effects on PA binding.
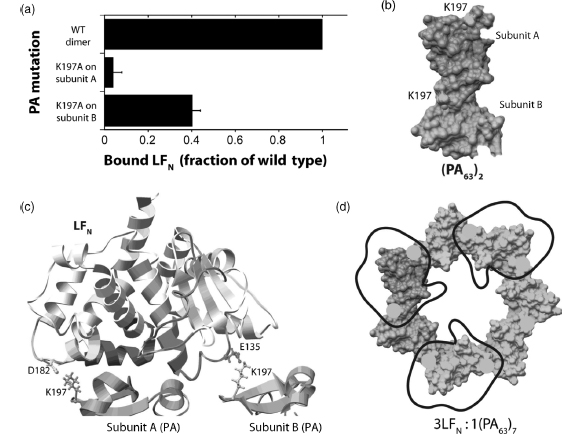
Mutaganesis Analysis of LFpj-PAss Complexes. Twenty-seven mutants were generated at surface-exposed residues within and near DX sites 1 and 2. Mutated proteins were 35S-labeled using in vitro incorporation of [35S]Met at the five methionine sites in LFN, and the proteins were then tested for ability to bind cells in the presence and absence of PA. The majority of the binding defective mutants identified here localized to DX site 2-4. These results suggested evidence that two residues on the PA binding surface of LFN (Glu-135 and Asp-182), which are ~40 A apart, interact with the same basic residue (Lys-197) on adjacent subunits of the precore. This result supports earlier findings that oligomerization of PA63 is required for LF or EF binding, that the footprint of LFN and EFN is large enough to block the binding sites on two PA subunits, and that the heptameric prepore binds only three molecules of EF and/or LF at saturation. The Glu-135-Lys-197 and Asp-182-Lys-197 interaction limit to the two possible orientations of LFN docked onto the prepore. The fact that mutations of Asp-182 and Lys-197 have greater effects on binding than subunit B mutations, Glu-135 and Lys-197, favors the orientation shown in Figure 7.9c.
These results demonstrate how the four sites within LFN identified by DX participated in the surface binding interactions and also provide an explanation for how a single LFN bridges two PA subunits. Most of the residues implicated in binding are expected to be charged at neutral pH values. The affinity of such an interface is expected to decrease with decreasing pH. Thus, the LF-PA interface appears to have been designed to have an inherent pH release trigger, which provides an elegant solution for dissociation of this nanomolar-affinity complex in the endosome. Our study demonstrates the power of H/D exchange mass spectrometry approaches for mapping complex protein-protein interaction surfaces.
Figure 7.9. H/D exchange and mutagenesis define a model for the LFN–PA interaction. (a) Data represent the fraction of mutant 35S-LFN bound to PA and mutants of PA on cells relative to that seen for the WT ternary complex. Error bars represent SE of the mean. (b) Surface representation of dimeric PA with K197 shown in yellow on subunits A and B. (c) LFN–PA2 model adapted from Lacy et al. with the two subunits (A and B) of PA shown in pink and cyan. DXsites 1–4 identified using H/D exchange are colored blue, green, yellow, and red, respectively. D182 and E135 side chains are shown for LFN and K197 side chains on both PA subunits are shown. (d) Top view of LFN binding to domain 1 of heptameric PA. Black trace represents outline of LFN. Yellow circles indicate K197 positions. Figures were generated using Chimera. Figure also appears in the Color Figure section.
DXMS ANALYSIS: CONCLUDING REMARKS
We have reviewed examples of how hydrogen/deuterium exchange mass spectrometry can be used to study protein structure, conformation, dynamics, and binding interactions. Our examples include the conformational changes of MntR, conformation and dynamics of PYP, and structural dynamics of LFj^PA complex. In the conformational studies of MntR, the metal-mediated DNA binding mechanism of MntR was elucidated, indicating that metal binding acts to rigidify MntR, therefore limiting the mobility of the protein and reducing the energy lost from DNA binding. In the conformational studies of PYP, wild-type PYP undergoes a light-induced tense to relaxed state transition upon formation of I2 signaling intermediate, yielding a more open, flexible, and relaxed protein fold. In the study of LFN-PA complex, DXMS combined with directed mutational analysis defined the surface on LFN that interacts with PA and further reveals the structural basis for anthrax lethal toxin assembly.
At present, the structural inferences drawn from DXMS analysis are oflow resolution, even when the data acquired are of high quality and information density. Limitations of the presently employed bioinformatics approaches to exploit and decipher the data are at the heart of the problem and there is a pressing need for improvement in this area.
HYBRID BIOCHEMICAL/BIOINFORMATICS APPROACH TO LOW-RESOLUTION STRUCTURE DETERMINATION USING CHEMICAL CROSS-LINKERS AND MASS SPECTROMETRY
Basic Principles of Using Chemical Cross-Linking for Structure Determination
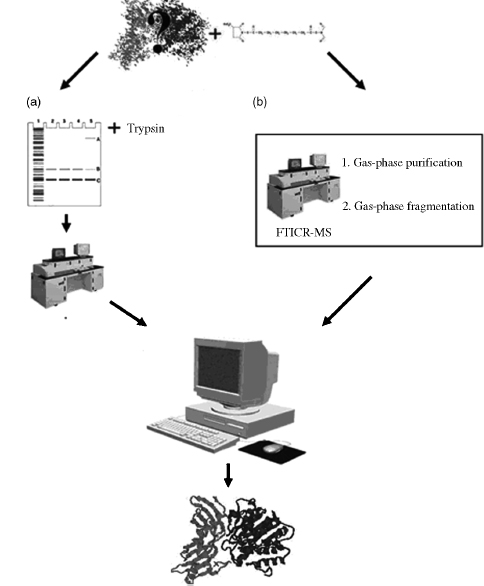
Two general approaches have been developed for analyzing cross-linked samples: bottom-up and top-down. The bottom-up process can be broken down into four distinct steps (Figure 7.10a). Firstly, the introduction of a cross-linking reagent into the protein(s) of interest by a one- or two-step chemical reaction. Secondly, proteolysis of the sample, followed by mass analysis of the fragments using a variety of available MS techniques. Finally, identified cross-links are used as distance constraints in molecular docking and/or modeling.
The top-down approach (Figure 7.10b) is a more direct approach to analyzing cross-linked species (Kelleher et al., 1999; McLafferty et al., 1999). It uses Fourier transform ion cyclotron resonance mass spectrometers (FTICR-MS) for both the purification and fragmentation steps. The cross-linked products are isolated in the ion cyclotron resonance (ICR) cell before being fragmented via one of several available fragmentation techniques. This technique has been mostly applied to intramolecular cross-linked products. The biggest disadvantage of the top-down approach is that large assemblies of proteins are difficult to analyze and may require the protein to be proteolysed into smaller fragments before FTICR analysis.
Chemical Cross-Linkers Overview
General Reagent Architecture. Chemical cross-linking has been used for decades for a wide variety of applications; hence, many variations of chemical cross-linkers are now commercially available. Based on their chemical functionalities, they can be organized into one of the four general classes: homobifunctional, heterobifunctional, trifunctional, and zero-length cross-linkers (Figure 7.11) (Sinz, 2006).
Homobifunctional cross-linkers are designed for simple one-step reactions. They contain two identical functional groups connected by a spacer of various lengths. Hetero-bifunctional cross-linkers contain two different functional groups and allow each to be incorporated in separate chemical reactions. This is especially useful when probing a complex of two proteins, where one side of the cross-linker can be reacted to one of the binding partners, while the second one is only activated when the other binding partner is added.
The next logical step was the introduction of another functional group to produce trifunctional cross-linkers. The third functional group is usually some kind of affinity tag (Trester-Zedlitz et al., 2003). Affinity tags allow for separation of cross-linkers from native peptides. Finally, zero-length cross-linkers covalently link amino acids without the incorporation of a linker (Duan and Sheardown, 2006).
Figure 7.10. The overall process for determining protein complex determination using chemical cross-linking and mass spectrometry in a top-down and bottom-up approach. After introducing the chemical cross-linker of choice in target protein/complex, the bottom-up approach (a) involves separation on an SDS-PAGE gel, in-gel digestion, and extraction of peptides. The extracted peptides are further analyzed by mass spectrometry. In the top-down approach (b) the separation and digestion is done in-source in an FTICR-MS. Both the approaches then use the recorded peptide masses to identify insertion points of cross-link by using a number of available online tools. The distance constraints can then be used in docking or modeling tools.
Cross-Linker Reactive Groups. Even though many cross-linkers are commercially available, their reactions with amino acids are based on only a handful of organic reactions (Figure 7.12). Mixing and matching a limited number of reactive groups with various spacers creates a large variety of cross-linkers for numerous applications. Most reactive groups can be categorized into one of the following reagents: amine-reactive, sulfhydryl-reactive, and photoreactive.
Figure 7.11. Examples of commercially available cross-linkers. (a) DTSSP is a homobifunctional amine reactive cross-linker. (b) SADP is a heterobifunctional cross-linker with amine and sulfhydryl-reactive groups. (c) Sulfo-SBED is a trifunctional cross-linker containing an amine-reactive and photoreactive group as well as a biotin tag. (d) EDC is a zero-length cross-linker, which reacts with amine and carboxylic acid groups.
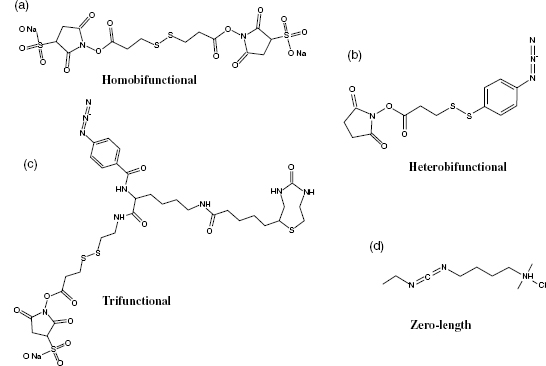
Figure 7.12. Chemical reactions between cross-linkers and protein. (a) Reaction ofNHS ester crosslinker and an amine forming an amide bond. (b) Reaction of maleimide and a sulfhydryl forming a thioether bond. (c) One of many possible radical reactions of phenyl azide.
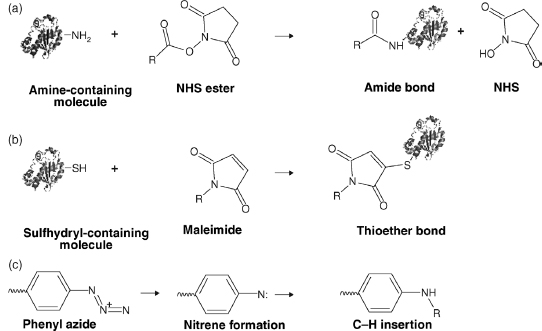
The two main types of amine reactive cross-linkers are NHS esters and imidoesters. The chemistry of both involves the reaction with primary amines. NHS esters form amide bonds by reacting with e-amines on lysine residues and free α-amines on N-termini of proteins (Bragg and Hou, 1975; Lomant and Fairbanks, 1976). Since reacted lysines are cleaved at extremely low frequencies by trypsin, larger fragments are formed when using this reagent. This may cause an increased difficulty in mass spectrometric identification. Similar to NHS esters, imidoesters also react with ε-amines and free α-amines of N-termini, however, they form amidine linkages instead of amide bonds.
Sulfhydryl-reactive reagents such as maleimides target thiol groups of cysteines to form thioether bonds. Unlike in amine reactive cross-linkers, lysine residues remain untouched allowing for efficient cleavage by trypsin. If the number of free thiols in a protein is low, introduction of new sulfhydryls can be performed by reacting primary amines with 2-iminothiolane.
Finally, photoreactive cross-linkers require UVor visible light to become reactive. The radical reaction in the presence of light forms a nitrene group that can be inserted into C—Hor N—H and allows for a controlled two-step reaction where one end of a cross-linker is inserted in the absence of light. Unlike otherreactive groups, cross-linkers containing a photoreactive functional group eliminate amino acid specificity and allow multiple residues to become cross-linking candidates; however, this makes finding the exactpoint of insertion difficult, as well as causing low yield of specific insertions.
The latest development in this approach has made it feasible to study interactions in living systems, which is extremely useful in understanding cellular processes. Two main strategies exist for this kind of approach, the first one being the incorporation of amino acids that can be photoactivated into proteins by the cell’s own translation machinery (Suchanek, Radzikowska, and Thiele, 2005). Such “man-made” amino acids as “photoleucine” are structurally similar to leucine and allow for straightforward incorporation. The second strategy involves expressing a tagged protein, then introducing formaldehyde that can pass through membranes and form cross-links between interacting proteins (Vasilescu, Guo, and Kast, 2004). A purification step can extract the protein of interest along with any proteins cross-linked to it for identification.
Types of Cross-Linker Insertions
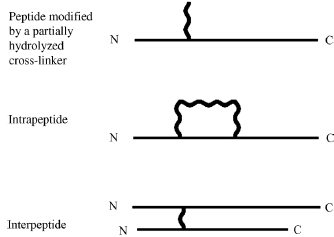
An important part of cross-linking is to understand what kind of products can be formed by reacting cross-linkers with proteins. Three types of products can be observed after proteoly-sis; these are assigned to type 0, 1, or 2 (Figure 7.13) (Schilling et al., 2003).
Type 0 product results when one end of the cross-linker is reacted with the protein while the other end is hydrolyzed, prohibiting it to further react. While this product does not provide distance constraints, it may be used as information regarding the surface accessibility of the amino acid. A type 1 product results when both reactive groups react within the same peptide. While these products do provide some distance constraints, in most cases they provide limited information since they are closely located in sequence.
When a cross-link connects two peptides together, a type 2 product is formed. The peptides must have either a proteolytic cleavage between them or originated from separate proteins. In the hybrid approach described here, this type of product usually provides the most useful information.
Figure 7.13. The three types of cross-linking products formed by bifunctional cross-linking reagents.
Mass Spectrometry Techniques and Limitations
Over the years, innovations in mass spectrometry techniques have allowed approaches such as the one described in this chapter to become a reality. With various types of mass spectrometers available, it is important to note the advantages and disadvantages of each.
MALDI-TOF Mass Spectrometers. Matrix-assisted laser desorption/ionization time of flight (MALDI-TOF) mass spectrometers have been utilized in numerous cross-linking studies (Itoh, Cai, and Khorana, 2001; Sinz and Wang, 2001; Pearson, Pannell, and Fales, 2002; Trester-Zedlitz et al., 2003; Sinz, Kalkhof, and Ihling, 2005). MALDI-TOF requires minimal amounts of material needed for analysis. A quick overlay of spectra from modified and nonmodified digested samples can lead to assignment of potential cross-linked peptides by mass alone (assuming a well-calibrated instrument).
However, a major drawback of MALDI-MS is its ionization preference for arginine-containing sequences as opposed to lysine-containing sequences (Krause, Wenschuh, and Jungblut, 1999). Arginines with a more basic side chain have a greater ionization efficiency than lysine and these are more easily detectable by MALDI-MS (Krause, Wenschuh, and Jung-blut, 1999). As trypsin is the most commonly used enzyme for proteolytic digestion, this becomes a sizable weakness. Conversion of lysines to homoarginines using O-methylisourea can be used to overcome this problem (Beardsley and Reilly, 2002). MALDI-TOF/TOF mass spectrometer can also boost its effectiveness for identifying cross-links as a MS/MS sequencing step can be added, as well as a preceding liquid chromatography separation step. Recently, a unique fragmentation pattern was observed when using MALDI-TOF/TOF to analyze samples cross-linked with a disulfide-based cleavable cross-linker, making it an invaluable tool.
Electrospray Ionization Mass Spectrometers. Another widely used mass spec-trometry for cross-linking analysis is electrospray ionization (Mouradov et al., 2006). Unlike MALDI-TOF, ESI does not display preference for arginine-containing peptides over those containing lysine. As with MALDI-TOF, a liquid chromatography step can be used prior to MS analysis. The formation of multiple ionization states by ESI-MS makes for a more time-consuming analysis.
Fourier Transform Ion Cyclotron Resonance Mass Spectrometers. Fourier transform ion cyclotron resonance mass spectrometers have ultrahigh resolution. Coupled with gas-phase purification and fragmentation, it replaces SDS-PAGE separation and proteolytic digestion that are required for analysis using other mass spectrometers (Dihazi and Sinz, 2003; Schulz et al., 2004). However, high cost and lack of availability limit its use in cross-linking studies.
Techniques for Cross-Link Identification
The biggest bottleneck with using chemical cross-linking for structural studies of proteins is the correct identification of cross-linked fragments within mass spectra that are mainly dominated by native tryptic fragments. While the cross-linking and mass spectrometry analysis steps can be done in a matter of days, the assignment of cross-links can be a difficult and often time-consuming exercise. Analysis of MS/MS fragmentation can help in identification; however, the spectra created will include simultaneous fragmentation of two peptides, greatly complicating the fragmentation pattern interpretation. Various approaches and specifically designed cross-linkers have been created to facilitate rapid and accurate identification of cross-linked fragments.
Heavy Cross-Linking Reagents. One of the first innovations to facilitate rapid identification of cross-linkers has been the use of isotope labeling. This approach commonly consists of replacing nonpolar hydrogen atoms by deuterium in the cross-link reagent, creating a chemically identical but heavier reagent. If this “heavy” reagent is used in a 1:1 ratio with the nondeuterated analogue cross-linker, doublet peaks separated by a defined mass (based on the number of deuterium atoms) will be observed in mass spectrometry analysis (Muller et al., 2001). Isotope-labeled cross-linkers, as well as their nonlabeled analogues, are commercially available and allow rapid identification of potential cross-linked fragments.
Cleavable Cross-Linking Reagents. Cleavable cross-linkers contain a disulfide bond or carboxylic ester in the spacer. The comparison of cleaved and noncleaved samples can pinpoint to cross-links within a spectrum as masses corresponding to type 2 cross-links will disappear after the cleavage, creating instead two masses corresponding to each arm of the cross-linker (Bennett et al., 2000; Davidson and Hilliard, 2003). Cleavage of cross-linked peptides also allows for a simplified MS/MS fragmentation pattern on the separate arms.
Affinity Tagged Cross-Linking Reagents. The addition of affinity tags (such as biotin) to cross-links allows for effective separation of modified peptides from native peptides via a purification step. Trifunctional cross-linkers containing affinity tag enrich low abundant cross-linked fragments for mass spectrometry analysis (Sinz, Kalkhof, and Ihling, 2005).
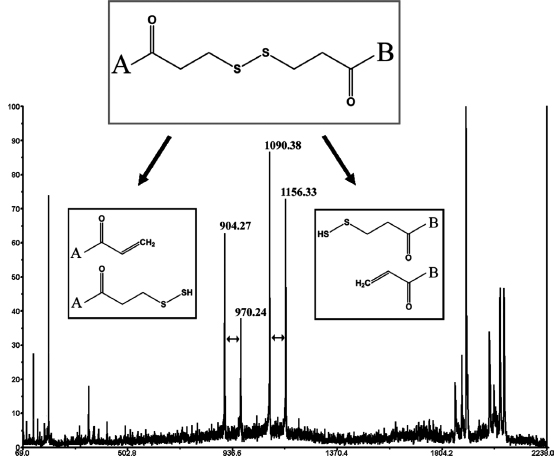
Fragmentation of DTSSP Cross-Linker. The latest advancement in identification of cross-linkers does not require any specially labeled cross-linkers or purifications steps. Instead, it uses the fragmentation properties of a commercially available cleavable cross-linker (DTSSP) for rapid identification (King et al., 2008). This technique takes advantage of a unique asymmetric breakage of disulfide bonds, which forms easily recognizable (66 amu) doublet signals during MALDI-TOF/TOF analysis. Two duplets will be formed for a type 2 cross-link, one for each of the two peptides (Figure 7.14). The doublet fragmentation appears analogous to the p-elimination of cysteine that produces thiocysteine and dehydroalanine.
Figure 7.14. Unique fragmentation of DTSSP cross-linked fragments using MALDI TOF/TOF-MS. The two sets of peaks, which are 66 amu apart, represent the asymmetric fragmentation of each half of the cross-linked species.
Structure Determination Using Sparse Constraints
With an ever-growing list of tools and techniques for identification of chemically inserted cross-links in proteins, the computational challenge is to use these sparse distance constraints for the purpose of structure prediction. Sparse distance constraints have been shown to improve success of threading algorithms and to predict the orientation of proteins in the complex. Early examples focused on postfiltering of threading results based on validation of the experimental constraints. Newer techniques allow the use of sparse constraints directly in building better models in the first place.
In Silico Hypothetic Cross-Linking Analysis. Albrecht et al. (2002) conducted an in silico analysis of how much distance constraints from chemical cross-linking can improve success with fold recognition by threading. The analysis was carried out on 81 non-redundant single-domain proteins (Hobohm96-25 database) whose pair-wise sequence identity does not exceed 25%. Cross-linking constraints were selected for aspartate, glutamate, and lysine residues between 8 and 12 A apart based on the known structures of the proteins. Constraints were used as a postfiltering method on alignments based on the 123D threading program. Various scoring functions on the validity of distance constraints were used including simply counting the number of satisfied constraints and a more complex scoring function that gives higher scores for satisfied constraints conserved among members of a fold class. The results show that even sparse constraints derived from cross-links can improve recognition rates from about 54-65% up to 58-73% depending on the quality of the initial alignment.
Postfiltering of Threading Using Cross-Link Derived Constraints. While the previous study used hypothetical cross-links, Young et al. (2000) used a similar postfiltering approach on a fibroblast growth factor-2 protein where 15 cross-links were experimentally identified using mass spectrometry techniques. Again the 123D threading tool was utilized and the top 20 structures were considered (when searched against a 635 protein database sharing less than 30% identity). Using just the 123D tool, the protein is incorrectly identified as belonging to the beta-clip fold family. However, a simple scoring function based on the number of satisfied constraints (within the 24 Amaximum cross-linking distance of the BS3cross-linker used) was then used to sort through the 20 top models. The first-, second-, and fourth-ranked structures all correctly identify the FGF-2 structure as part of the beta-trefoil family.
Distance Constraints in Threading. The next evolutionary step would be to incorporate the sparse distance constraints into the actual threading algorithm. Xu et al. (2000) detail an approach that uses NMR nuclear Overhauser effect (NOE) distance restraints to improve threading performance. Even though NOEs provide less sparse data, a similar approach can also be applied to more sparse constraints derived from chemical cross-linking and mass spectrometry. Xu et al. employ a “divide and conquer” strategy that divides the structures into substructure sets comprising only of one secondary structure, and then optimally aligns substructures with subsequences. Two conditions must be always met to incorporate the distance constraints: (1) a link must be present for a constraint to be aligned to two cores, and (2) linked cores must not be aligned to sequence positions that violate constraints. Results show that even a small number of NOEs were sufficient to improve threading success in difficult to predict proteins from 70% to 92.7%.
Distance Constraints in Docking Algorithms. The most promising application for distance constraints derived from cross-linking and mass spectrometry may be the structure determination of multidomain proteins and protein complexes, specifically where the structures of the separate components are known but the orientation with respect to each other, however, is not. Docking tools such as “HADDOCK” (Dominguez, Boelens, and Bonvin, 2003) have been developed to use distance constraints as an input. Docking algorithms specifically optimized to incorporate sparse constraints from cross-linking data have also been successfully employed.
Studies by Mouradov et al. (2006) and Forwood et al. (2007) have shown how docking algorithms, specifically designed to incorporate sparse distance constraints from cross-links, can be used to determine how the separate units in a protein complex and multidomain protein interact (Figure 7.15). The docking algorithm used a systematic six-dimensional search over all rotations in steps of five degrees and all Cartesian translations of 1.0Å up to ±66Å along each coordinate axis. Given the cross-linker reagent used in the two studies, the maximal Ca-Ca distance between cross-linked residues was estimated at 25Å; models with distances larger than 25Å were therefore immediately excluded from further analysis. An optimized prescreening test was added, where only the coordinates of those residues involved in the constraints were rotated and translated. Only when the constraints were met, were the rest of the coordinates rotated and translated and a full analysis was carried out. This allowed screening for a large set of docking positions that would have been computationally costly using a conventional method. Models were scored by a simple hydrophobic energy score that counts the number of contacts (<8Å) between hydrophobic amino acids (A, V, L, I, F, C, M, W). For each rotation, the 10 best scoring models were retained. Final models were sorted according to their hydrophobic score and the 1000 best models considered. This approach has been applied to predict the structure of a protein complex to within 4Å root-mean-square deviation (RMSD) with information from only three interprotein cross-links as well as to propose structure of the multidomain mouse protein acytel-CoA thioesterase 7 (Acot7).
Figure 7.15. Flow diagram of docking algorithm used in studies by Mouradov et al. and Forwood etal. to compute models based on constraints from chemical cross-linking. The optimization step, of only rotating/translating amino acids involved in the constraint to check for validity before rotating/ translating the rest of the molecule, allows for a large number of configurations to be analyzed.

In the recent years, the hybrid approach described here has been implemented in proof-of-concept experiments as well as in structure prediction. Much research has been put into simplifying identification of cross-linked fragments.
Back et al. (2002) presented a novel approach to screen proteolytic mass spectra maps of cross-linked protein complexes for the presence of cross-linked peptides. The approach was based on the incorporation of 18O heavy water into the C-termini of proteolytic peptides. Cross-links linking two peptides are readily distinguished in mass spectra by a characteristic 8 amu shift when compared to normal water digests due to the incorporation of two 18O atoms in each C-terminus (Figure 7.16). As proof of principle, Back et al. successfully applied the method to a complex of two DNA repair proteins (Rad18-Rad6) and identified the interaction site.
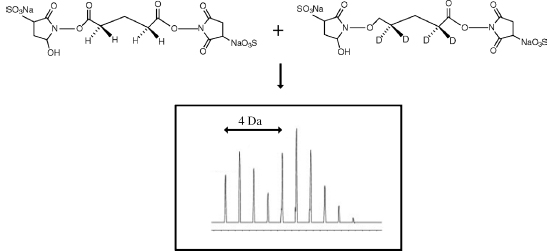
A similar approach was undertaken by Muller at al. (2001); however, instead of heavy and light water, labeled cross-linkers were used. The deuterium-labeled cross-linking reagents bis(sulfosuccinimidyl)-glutarate-d(4), -pimelate-d(4), and -sebacate-d(4) were synthesized (labeled cross-linkers are now commercially available) as well as their undeuterated counterparts. In these cross-links, four nonpolar hydrogens present on the linker were replaced with deuterium. The cross-linking reaction is carried out in a 1:1 mixture of nonlabeled and deuterium-labeled isomers. When compared to native peptides, those that have been modified will be observed as mass signals with 4 Da separation (Figure 7.17), allowing for a straightforward detection. This methodology facilitated a refined view of the complex between Op18 and tubulin corroborating the tubulin “capping” activity of the N-terminal domain of Op18.
Figure 7.16. The formation of a type 2 cross-link in the presence of normal water (left) and in the presence of a 1:1 mixture of normal and 18O heavy water (right). Each +2amu peak in the 1:1 mixture shows the insertion of an extra 18O heavy water.

Figure 7.17. Cross-linking using a 1:1 mixture of nonlabeled and deuterium-labeled cross-linker isomers results in a distinct pattern, with doublet peaks 4amu apart resulting from the four deuterium atoms present in the deuterium-labeled cross-linker.
Alternative approaches to deriving distance constraints from cross-linking experiments have been proposed. While traditionally a bottom-up approach is used for cross-linking experiments where the sample is digested in gel before analyzing the peptide fragments mass, a top-down approach initially proposed by McLafferty et al. (1999) is becoming popular. This approach is used to address some possible limitations of the bottom-up approach, including time-consuming separation steps, such as separating cross-linked complexes, as well as a susceptibility to artifacts due to man-made peptide modifications (formylation, oxidation, and sodiation). Kruppa, Schoeniger, and Young (2003) demonstrate that cross-link insertion points can be identified by the use of electrospray ionization Fourier transform mass spectrometry (FTMS) on a crude cross-linked sample. The need for chromatographic separation is replaced with a “gas-phase purification” in the FTMS analyzer cell, while proteolytic digestion is replaced by a gas-phase fragmentation and MS/MS analysis. Using a lysine-specific homobifunctional cross-linking reagent disucci-nimidyl suberate (DSS) and ubiquitin, two cross-links were identified and confirmed to be consistent with the known protein structure. This approach lends itself to a true high-throughput methodology where various cross-linkers and reactions can be analyzed quickly and inexpensively.
Various cross-linking studies show exactly how the derived distance can be used to propose distance constraint. Young et al. (2000) used BS3 cross-linker to correctly identify the fold of a fibroblast growth factor 2 (FGF2) protein. BS3 cross-links were identified by TOF-MS and confirmed by postsource decay MS. The 18 identified cross-links correctly identified the FGF2 as a member of the IL-1 p family even though the sequence identity was less than 13%. While the cross-links were not directly used in model building, they were used to help sort through models obtained by threading. Without the distance constraints, the FGF2 protein would have been incorrectly identified as a member of the p-clip fold family. Furthermore, Young et al. were able to build a structure based on homology IL-1β (without the use of cross-links) to within 4.8Å root-mean-square deviation to the backbone. This work was one of the first to show how cross-links can be used to filter out incorrect threading matches.
Figure 7.18. Docking of carboxypeptidase A (dark gray) to latexin (black) using in-house rigid body docking software. (a) The top 1000 structures are shown. (b) The top-scoring cluster based on average hydrophobic interaction scoring. (c) The top-scoring docked structure. (d) The positions of the three identified cross-links (black lines) are also shown with respect to the 3D structure.
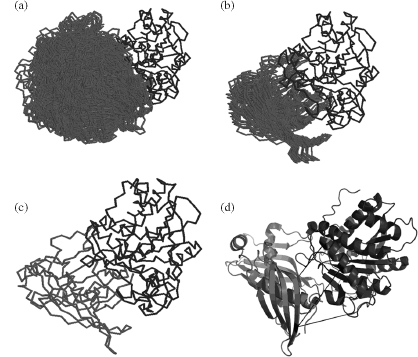
Mouradov et al. (2006) derived a structure of a complex between carboxypeptidase A and latexin based on chemical cross-linking and molecular docking. While the crystal structures of the separate molecules were known, the complex between the two proteins had yet to be solved. The BS3 cross-linker was used in combination with LC-ESI-MS to identify cross-linked peptides. The three identified cross-linked fragments between the two molecules were used in a simple rigid body docking algorithm that implemented a hydrophobic scoring function. Shortly after this work, a crystal structure of homologous proteins was solved between carboxypeptidase A and latexin, allowing to test the success/accuracy ofthe approach. The comparison of the backbone revealed that the predicted structure of the complex was only ~4Å RMSD (Cα) from the crystal structure (Figure 7.18).
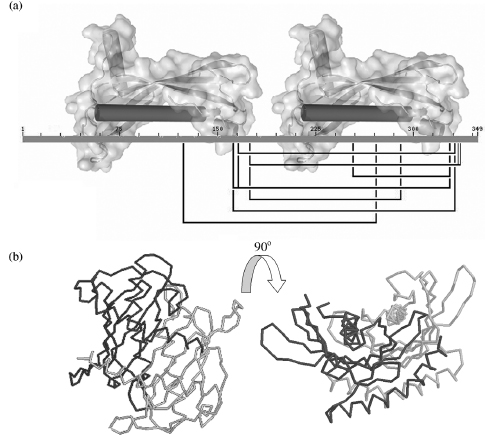
This approach was also carried out on a multidomain protein, long-chain acyl-CoA thioesterase 7 (Forwood et al., 2007). The thioesterase is composed of two hot-dog fold domains and converts acyl-coenzyme A to coenzyme A and free fatty acids. The crystal structures of the two domains were solved separately; however, the full-length protein could not be crystallized. The Use of BS3 and DTSSP (3,3’-dithiobis[sulfosuccinimidylpropio-nate]) cross-linking reagents, coupled with MALDI-TOF, allowed for the identification of eight interdomain cross-links. These cross-links were used for both homology modeling and molecular docking (Figure 7.19). For modeling, the distance constraints were used in conjunction with homology to the structure of bacterial thioesterases. The model was confirmed using rigid body docking with the two domains as separate molecules (using no prior assumptions on structural arrangement).
Figure 7.19. (a) 2D view of identified cross-links connecting the two hot-dog fold domains of the acyl-CoA thioesterase. (b) Orthogonal view of the derived orientation of the two hot-dog fold domains based on cross-linking data.
Until recently, the top-down approach has been limited to analysis of protein structures from intramolecular cross-linking experiments. Schmidt et al.(2005)) combined the advantages of Fourier transform ion cyclotron resonance, such as excellent mass resolution, ultrahigh mass measurement accuracy, and high sensitivity, with enzymatic digestion that allows the analysis of large protein complexes. To further facilitate the identification of cross-linked fragments, deuterium-labeled cross-linkers were also used. The study involved the complex between calmodulin and a 25-amino acid peptide from the C-terminal region of adenylyl cyclase. Five separate lysine residues in calmodulin linked to one single lysine in the 25-amino acid peptide were identified. While no structure was proposed, the study proposes a convenient approach to obtain protein structural data in limited time.
One of the most promising applications of cross-linking is in membrane proteins that play a central role in signaling, transport, and energy. Despite their importance, relatively few membrane protein structures have been solved using X-ray crystallography or NMR when compared to soluble proteins. Jacobsen et al. (2006) have demonstrated that structural information can be derived from proteins purified in their native membrane. The G-protein-coupled receptor rhodopsin was used as the model system. Seven different cross-linking reagents in combination with FTICR mass spectrometry were used to identify a total of 28 intramolecular cross-links. All but one cross-link was theoretically viable based on the crystal structure. The one inexplicable cross-link is in the C-terminal region for which biochemical data from other studies suggest that it is highly mobile in solution.
CONCLUSION WITH RESPECTTO CHEMICAL CROSS-LINKAGE METHODS
The techniques described in this chapter have been shown to provide distance data on proteins that are useful to determine 3D structures at low to medium resolution. While chemical cross-linking provides a limited number of constraints, they can be enough to filter correct from incorrect models oreven predict orientation ofinteracting domains orproteins. While only a limited number of studies have used this technique to propose a structure, much research has gone into developing more efficient ways to identify exact insertion points of cross-links. These innovations, along with mass spectrometry becoming a more commonly used research tool in many departments, demonstrate the potential for chemical cross-linking to become a powerful and widely used approach for swift and inexpensive structure determination.
ACKNOWLEDGMENTS
This work was supported by NIH Grants CA099835, CA118595, GM037684, AI0220221, AI022160, GM20501 and a Discovery Grant (UC10591) from the University of California Industry-University Cooperative Research Program, Biogen Idec Inc. corporate sponsor (V.L.W). B.K. is an ARC Federation Fellow and a National Health and Medical Research Council (NHMRC) Honorary Research Fellow.